Healthcare Working Capital Index 2026
by JPMorgan
S T R I C T L Y P R I V A T E A N D C O N F I D E N T I A L HEALTHCARE W ORKING CAPITAL INDEX J . P. MO R G AN PAY ME N TS | G L O B AL AD VIS O R Y | 2 0 2 6 S T R I C T L Y P R I V A T E A N D C O N F I D E N T I A L
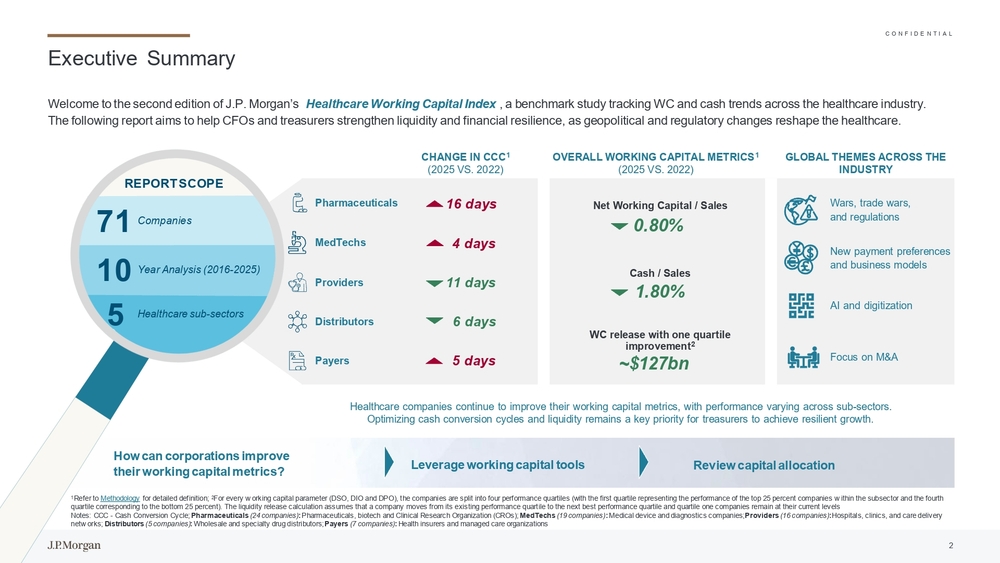
C O N F I D E N T I A L Executive Summary Welcome to the second edition of J.P. Morgan’s Healthcare Working Capital Index , a benchmark study tracking WC and cash trends across the healthcare industry. The following report aims to help CFOs and treasurers strengthen liquidity and financial resilience, as geopolitical and regu latory changes reshape the healthcare. 71Companies Year Analysis (2016 -2025) 10 Healthcare sub -sectors 5REPORT SCOPE Wars, trade wars, and regulations New payment preferences and business models Focus on M&A AI and digitization CHANGE IN CCC1 (2025 VS. 2022) Pharmaceuticals MedTechs Providers Distributors Payers16 days 4 days 11 days 6 days 5 daysOVERALL WORKING CAPITAL METRICS1 (2025 VS. 2022)GLOBAL THEMES ACROSS THE INDUSTRY 1Refer to Methodology for detailed definition; 2For every w orking capital parameter (DSO, DIO and DPO), the companies are split into four performance quartiles (with the fir st quartile representing the performance of the top 25 percent companies w ithin the subsector and the fourth quartile corresponding to the bottom 25 percent). The liquidity release calculation assumes that a company moves from its exi sting performance quartile to the next best performance quartile and quartile one companies remain at their current levels Notes: CCC -Cash Conversion Cycle; Pharmaceuticals (24 companies) :Pharmaceuticals, biotech and Clinical Research Organization (CROs); MedTechs (19 companies) :Medical device and diagnostics companies; Providers (16 companies) :Hospitals, clinics, and care delivery netw orks; Distributors (5 companies) :Wholesale and specialty drug distributors; Payers (7 companies) :Health insurers and managed care organizationsNet Working Capital / Sales 0.80% Cash / Sales 1.80% WC release with one quartile improvement2 ~$127bn 2How can corporations improve their working capital metrics?Leverage working capital toolsHealthcare companies continue to improve their working capital metrics, with performance varying across sub -sectors. Optimizing cash conversion cycles and liquidity remains a key priority for treasurers to achieve resilient growth. Review capital allocation
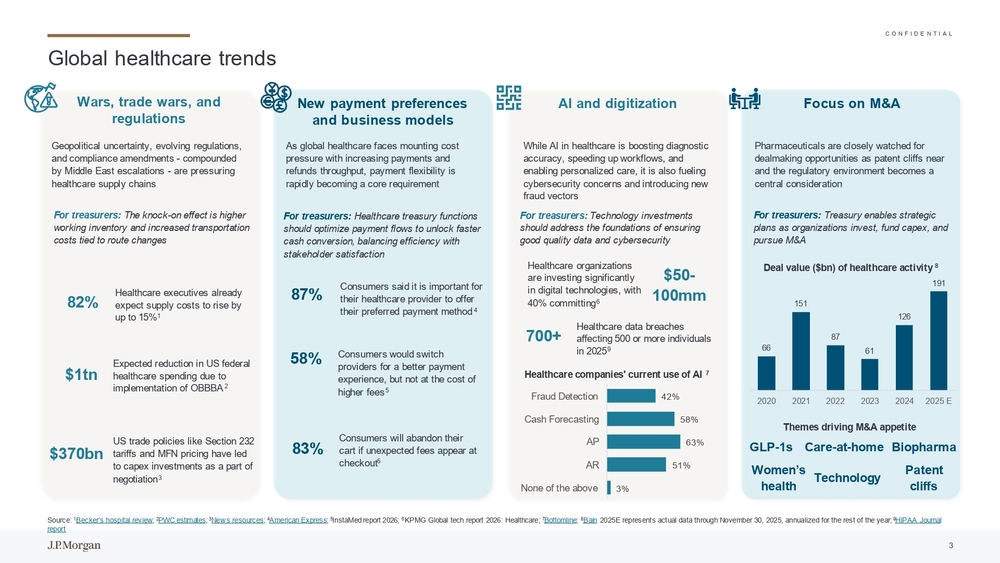
C O N F I D E N T I A L Global healthcare trends New payment preferences and business modelsFocus on M&A AI and digitization As global healthcare faces mounting cost pressure with increasing payments and refunds throughput, payment flexibility is rapidly becoming a core requirement 87%Consumers said it is important for their healthcare provider to offer their preferred payment method4 Consumers would switch providers for a better payment experience, but not at the cost of higher fees558% Consumers will abandon their cart if unexpected fees appear at checkout583%Wars, trade wars, and regulations 82%Healthcare executives already expect supply costs to rise by up to 15%1Geopolitical uncertainty, evolving regulations, and compliance amendments -compounded by Middle East escalations -are pressuring healthcare supply chains $1tn $370bnExpected reduction in US federal healthcare spending due to implementation of OBBBA2 US trade policies like Section 232 tariffs and MFN pricing have led to capex investments as a part of negotiation3For treasurers: The knock -on effect is higher working inventory and increased transportation costs tied to route changesFor treasurers: Healthcare treasury functions should optimize payment flows to unlock faster cash conversion, balancing efficiency with stakeholder satisfactionWhile AI in healthcare is boosting diagnostic accuracy, speeding up workflows, and enabling personalized care, it is also fueling cybersecurity concerns and introducing new fraud vectors For treasurers: Technology investments should address the foundations of ensuring good quality data and cybersecurityPharmaceuticals are closely watched for dealmaking opportunities as patent cliffs near and the regulatory environment becomes a central consideration 42% 58% 63% 51% 3%Fraud Detection Cash Forecasting AP AR None of the aboveHealthcare companies' current use of AI7Healthcare organizations are investing significantly in digital technologies, with 40% committing6For treasurers: Treasury enables strategic plans as organizations invest, fund capex, and pursue M&A 66151 87 61126191 2020 2021 2022 2023 2024 2025 EDeal value ($bn) of healthcare activity8 Source: 1Becker’s hospital review ; 2PWC estimates ; 3New s resources ; 4American Express ; 5InstaMed report 2026; 6KPMG Global tech report 2026: Healthcare; 7Bottomline ; 8Bain 2025E represents actual data through November 30, 2025, annualized for the rest of the year; 9HIPAA Journal report700+Healthcare data breaches affecting 500 or more individuals in 20259 3$50- 100mm Themes driving M&A appetite GLP -1sCare -at-home Women’s healthPatent cliffsTechnologyBiopharma
C O N F I D E N T I A L Pharmaceuticals | Trends ⚫Consider adoption of IHB, OBO modelsDigital preferences: Companies in this sector are moving toward omnichannel digital payout platforms with clear status tracking and configurable options by patient preference AI for new discoveries: Generative and agentic AI are being applied across target discovery, trial design, and manufacturing optimization Resurgence in deals: Rather than relying solely on internal pipelines, companies are using M&A to gain access to approved products, established commercial infrastructures and diversified revenue streams⚫Supply chain financing ⚫Liquidity centralizationManufacturing shift: T ariffs and geopolitical tensions are driving nearshoring/onshoring of manufacturing and API production, with companies pledging billions in U.S. facility investments to mitigate supply chain risks and secure exemptions Lack of feasible substitutes: Substitution is slow and capital -intensive in pharmaceuticals due to regulatory requirements, which raises affordability risks and constrains how quickly supply chains can move ⚫Capex readiness Source: JPM internal research, Healthcare Treasury Insights , new s runs; Notes: API: Active Pharmaceutical Ingredients; RNA: Ribonucleic Acid; CVR: Contingent Value Rights ; IHB: In House Bank; OBO: On -behalf -of⚫Marketplaces, D2C models ⚫Leverage physical and notional pooling Wars, trade w ars, and regulations New payment preferences AI and digitization Focus on Mergers and AcquisitionsWhat should treasury focus on 4
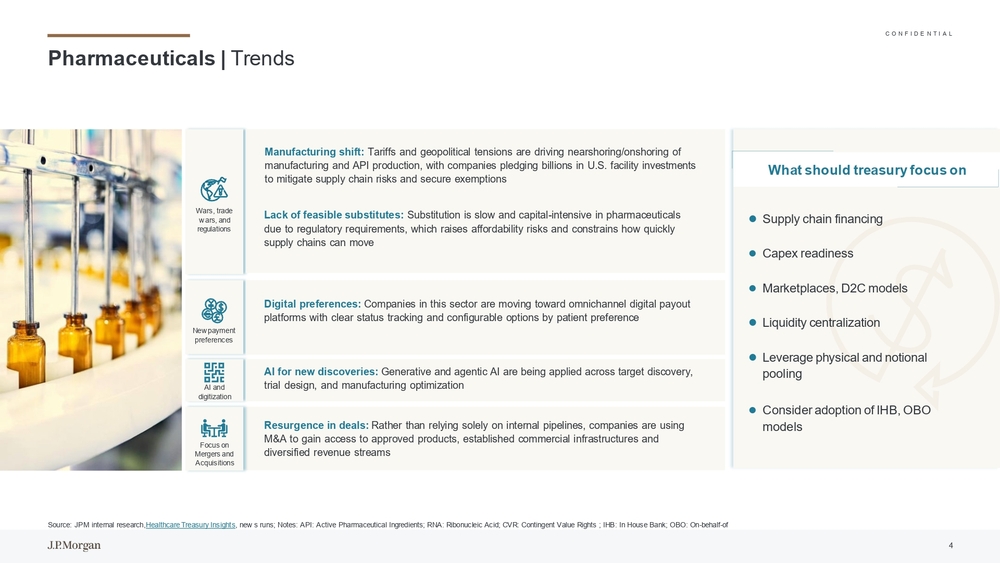
C O N F I D E N T I A L ⚫Cash/Sales dipped to ~18% in 2025, on the backdrop of rising M&A, R&D expenditure to combat patent cliffs, capex investments in AI, technology, manufacturing capabilities, and increasing shareholder returns ⚫Pharma companies like J&J, Pfizer, etc. have invested ~USD 370bn1 in U.S. domestic manufacturing⚫NWC/Sales reached ~27% in 2025, indicating higher cash tied up in operations as compared to 2016 as well as 2022 (pre and post covid) ⚫This increase is primarily driven by cash tied up in inventory, and can be observed through an increased DIOPharmaceuticals | Metrics on Cash Conversion Cycle, Working Capital, and Cash Efficiency Source: J.P. Morgan analysis based on data from Capital IQ as of May 2026; 1Fierce Pharma Notes: CCC -Cash Conversion Cycle, DSO -Days Sales Outstanding, DIO -Days Inventory Outstanding, DPO -Days Payable Outstandi ng. Refer to Methodology for detailed definition Navigating the road aheadChange since 2022 2days 23days 6 days⚫CCC increased to 168 days in 2025, primarily driven by an increasing DIO ⚫DSO has been stable at ~72 -74 days, except during COVID ⚫DIO is at an all time high at 202 days, with companies building up their supply chain resilience on the backdrop of evolving tariff scenarios and Middle East escalations, adopting “just -in-case” approach for inventory management ⚫DPO has improved substantially, supported by supply chain financing arrangements and preferential payment terms from vendor networksCash Conversion Cycle trendsNWC/Sales Cash/Sales25%25%26% 26%27% 26% 26%27% 26%27% 29%30%31% 29% 25% 22% 23% 21% 18% 18% 2016 2017 2018 2019 2020 2021 2022 2023 2024 2025Net Working Capital trends Cash trends74 75 75 75 78 74 74 76 73 72 157 163 169 170181 172 179 194 197 202 100 101 102 102 10599 101 104 103 107 2016 2017 2018 2019 2020 2021 2022 2023 2024 2025DSO DIO DPO16days130 136 142 143154 147 152166 167 168 CCC Focus on inventory optimization to improve cash conversion cycles, especially in times of geopolitical and regulatory uncerta inty Maintain adequate liquidity to support expansion and diversification of business while maintaining financial resilience 5
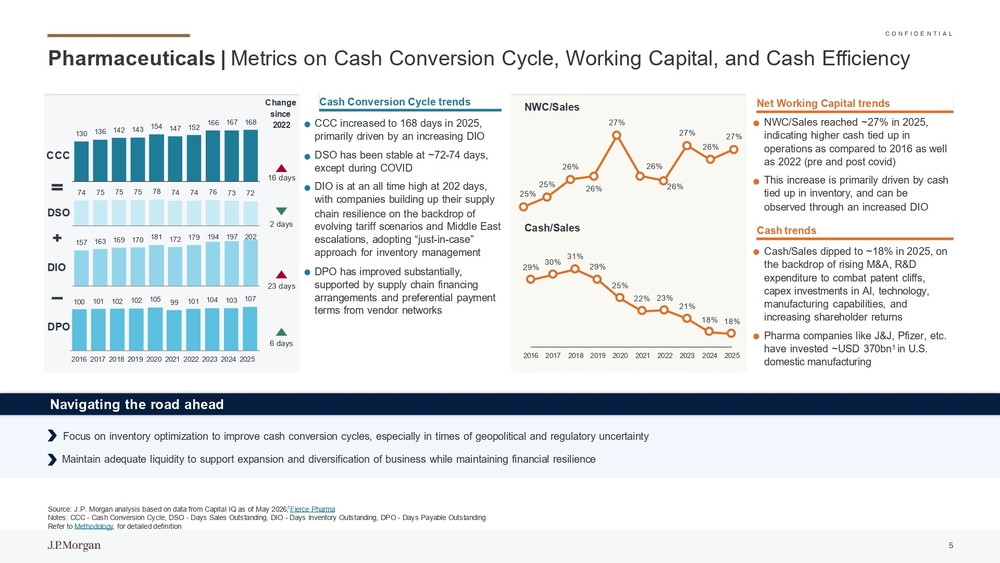
C O N F I D E N T I A L MedTechs | Trends ⚫Liquidity centralization Upfront payments: While upfront payment remains the norm, MedT ech companies are increasingly piloting pay -per-use and staged payment models, particularly for high -ticket equipment purchases Scaling up AI: AI-enabled diagnostics, clinical decision support, and imaging tools are scaling, with Software as a Medical Device (SaMD) becoming a mainstream growth area Focus on technology: AI-enabled platforms, digital ecosystems, high growth areas covering robotics, cardiovascular, minimally invasive surgeries will remain key targets as larger healthcare firms continue to build capabilities ⚫Physical, notional pooling Ripple effects of tariffs: T ariffs on metals, electronics, and finished devices can slow product launches, increase bill -of-materials and assembly costs, with limited ability to pass all costs on in regulated or tender -driven markets Regulatory impact: The RAPID Coverage pathway, launched by CMS and FDA in the U.S., could expedite access to certain breakthrough devices for people with access to Medicare* Source: JPM internal research, new s runs; * FDA new s ; Notes: RAPID: Regulatory Alignment for Predictable and Immediate Device; CMS: Centers for Medicare & Medicaid Services; FDA : U.S. Food and Drug Administration; ⚫Virtual accounts for better liquidity⚫Inventory financing ⚫Sales financing ⚫Supply chain financingWars, trade w ars, and regulations New payment preferences AI and digitization Focus on Mergers and AcquisitionsWhat should treasury focus on 6
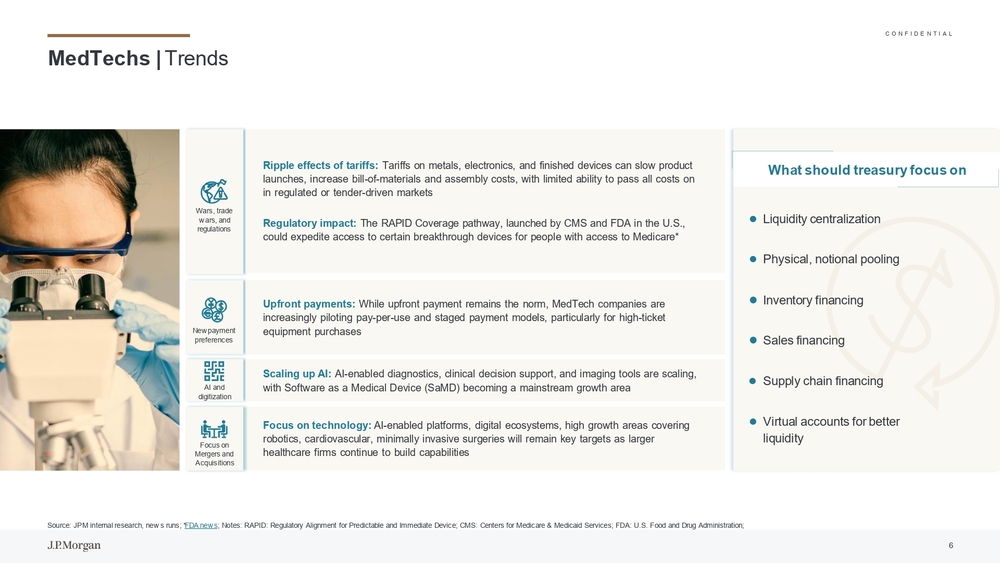
C O N F I D E N T I A L ⚫Cash/Sales dipped to 17% in 2025, indicating higher cash deployment for integration of AI technology in devices, M&A, dividends and share buybacks ⚫MedT ech companies considered for analysis paid ~USD 10bn2and ~USD 13bn2for dividends and share buyback respectively in 2025⚫Increase in adoption of programs to maintain a lean working capital, with active focus on inventory reduction by companies like Zimmer Biomet and Agilent T echnologies1MedTechs | Metrics on Cash Conversion Cycle, Working Capital, and Cash Efficiency Source: J.P. Morgan analysis based on data from Capital IQ as of May 2026; 1Alphasense (Analyst Reports, Earning calls and Company financials); 2Figures as per 19 companies considered for analysis Notes: CGM -Continuous Glucose Monitors, D2C -Direct to Customer, CCC -Cash Conversion Cycle, DSO -Days Sales Outstanding, D IO -Days Inventory Outstanding, DPO -Days Payable Outstanding, SKU –Stock Keeping Unit. Refer to Methodology for detailed definition Navigating the road aheadChange since 2022 2days 1 day 7 days⚫CCC at 147 days was supported by improved DSO and DIO ⚫Improvement in DSO was largely dictated by unique procurement models of various public and private healthcare providers ⚫Additionally, CGM manufacturers like Abbott and Medtronic are shifting to pharmacy and D2C channels for faster collections, leading to improved DSO ⚫MedT ech companies continue to reduce inventory levels through increased local manufacturing capability and offloading buffer stocksCash Conversion Cycle trendsNWC/Sales Cash/Sales24% 24%24% 25%27% 25%26%28% 27% 26% 25%25% 21% 20%24% 20% 18%19% 18% 17% 2016 2017 2018 2019 2020 2021 2022 2023 2024 2025Net Working Capital trends Cash trends Rethink strategies to unlock cash through targeted SKU rationalization, reduction in slow moving and buffer inventory and imp roved forecast planning Scale liquidity structures and centralize cash visibility to manage multi -entity and multi -currency flows, enabling favorable fi nancing decisions 64 66 65 65 68 63 64 64 63 62 113 113 115 123133 127 135144 143134 46 51 52 54 56 55 56 53 51 49 2016 2017 2018 2019 2020 2021 2022 2023 2024 2025DSO DIO DPO4days130 128 127 133145135143155 155147 CCC 7
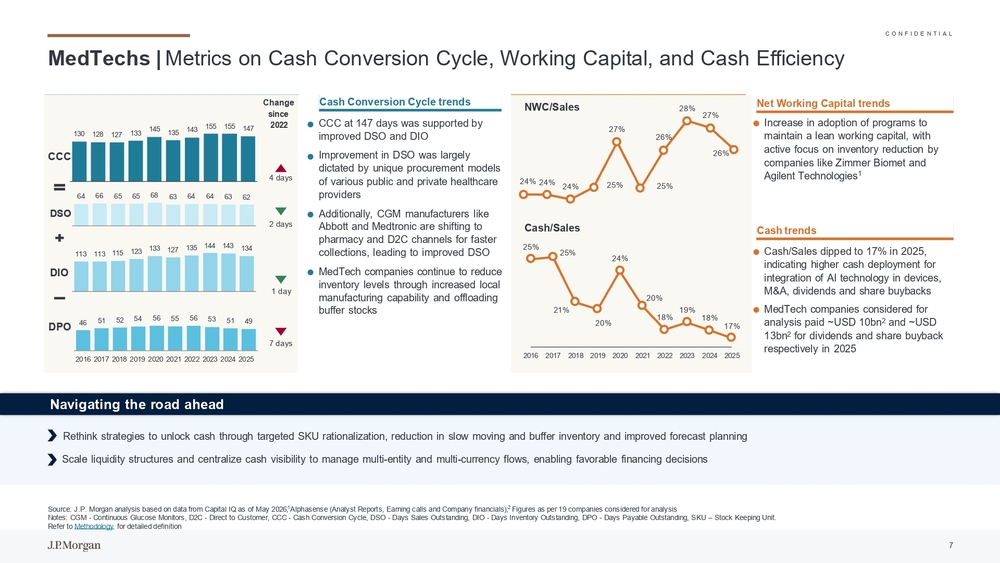
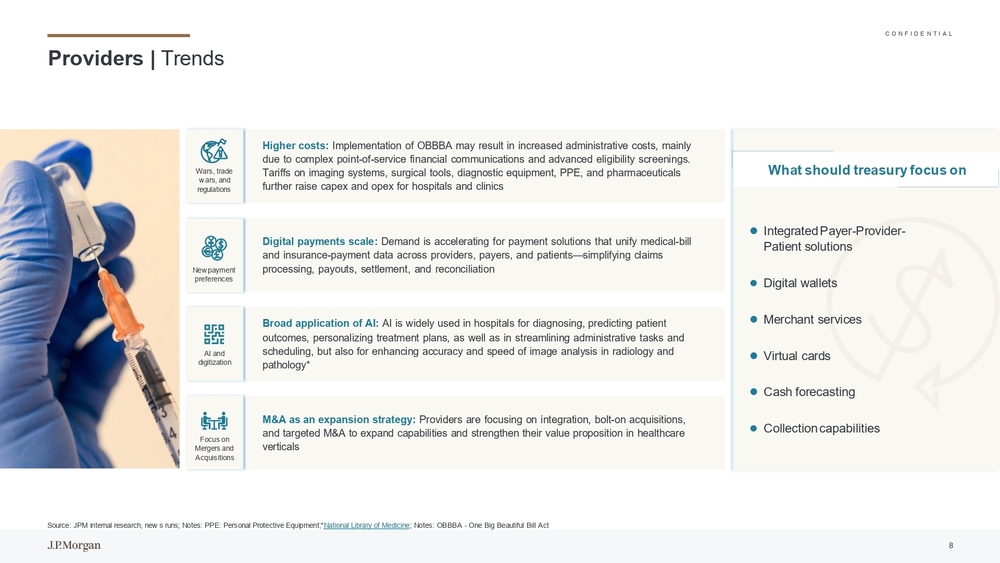
C O N F I D E N T I A L Providers | Trends ⚫Digital wallets ⚫Merchant services ⚫Virtual cards⚫Integrated Payer -Provider - Patient solutions Source: JPM internal research, new s runs; Notes: PPE: Personal Protective Equipment; National Library of Medicine ; Notes: OBBBA -One Big Beautiful Bill Act⚫Cash forecasting Broad application of AI: AI is widely used in hospitals for diagnosing, predicting patient outcomes, personalizing treatment plans , as well as in streamlining administrative tasks and scheduling, but also for enhancing accuracy and speed of image analysis in radiology and pathology Digital payments scale: Demand is accelerating for payment solutions that unify medical -bill and insurance -payment data across providers, payers, and patients —simplifying claims processing, payouts, settlement, and reconciliation Higher costs: Implementation of OBBBA may result in increased administrative costs, mainly due to complex point -of-service financial communications and advanced eligibility screenings. Tariffs on imaging systems, surgical tools, diagnostic equipment, PPE, and pharmaceuticals further raise capex and opex for hospitals and clinics M&A as an expansion strategy: Providers are focusing on integration, bolt -on acquisitions, and targeted M&A to expand capabilities and strengthen their value proposition in healthcare verticals ⚫Collection capabilitiesWars, trade w ars, and regulations New payment preferences AI and digitization Focus on Mergers and AcquisitionsWhat should treasury focus on 8
C O N F I D E N T I A L
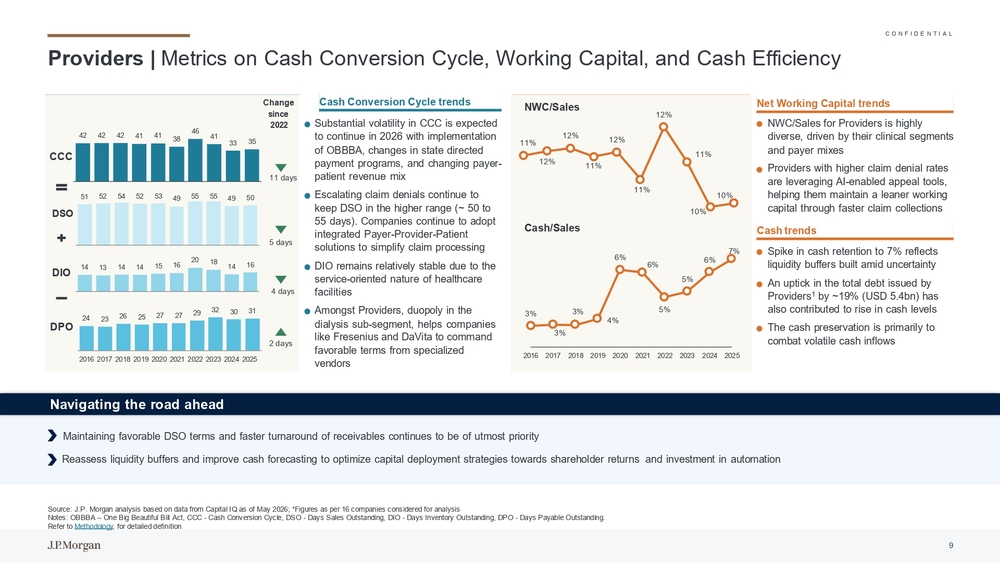
⚫Spike in cash retention to 7% reflects
liquidity buffers built amid uncertainty
⚫An uptick in the total debt issued by
Providers1by 19% (USD 5.4bn) has
also contributed to rise in cash levels
⚫The cash preservation is primarily to
combat volatile cash inflows⚫NWC/Sales for Providers is highly
diverse, driven by their clinical segments
and payer mixes
⚫Providers with higher claim denial rates
are leveraging AI -enabled appeal tools,
helping them maintain a leaner working
capital through faster claim collectionsProviders | Metrics on Cash Conversion Cycle, Working Capital, and Cash Efficiency
Source: J.P. Morgan analysis based on data from Capital IQ as of May 2026; *Figures as per 16 companies considered for analys is
Notes: OBBBA –One Big Beautiful Bill Act, CCC -Cash Conversion Cycle, DSO -Days Sales Outstanding, DIO -Days Inventory Outst anding, DPO -Days Payable Outstanding.
Refer to Methodology for detailed definition
Navigating the road aheadChange
since
2022
5days
4 days
2 days⚫Substantial volatility in CCC is expected
to continue in 2026 with implementation
of OBBBA, changes in state directed
payment programs, and changing payer -
patient revenue mix
⚫Escalating claim denials continue to
keep DSO in the higher range ( 50 to
55 days). Companies continue to adopt
integrated Payer -Provider -Patient
solutions to simplify claim processing
⚫DIO remains relatively stable due to the
service -oriented nature of healthcare
facilities
⚫Amongst Providers, duopoly in the
dialysis sub -segment, helps companies
like Fresenius and DaVita to command
favorable terms from specialized
vendorsCash Conversion Cycle trendsNWC/Sales
Cash/Sales11%
12%12%
11%12%
11%12%
11%
10%10%
3% 3%
3%4%6%
6%
5%5%6%7%
2016 2017 2018 2019 2020 2021 2022 2023 2024 2025Net Working Capital trends
Maintaining favorable DSO terms and faster turnaround of receivables continues to be of utmost priority
Reassess liquidity buffers and improve cash forecasting to optimize capital deployment strategies towards shareholder returns and investment in automation51 52 54 52 534955 5549 50
14 13 14 14 15 16201814 16
24 2326 25 27 272932 30 31
2016 2017 2018 2019 2020 2021 2022 2023 2024 2025DSO
DIO
DPO11days42 42 42 41 41384641
33 35
CCC
Cash trends
9
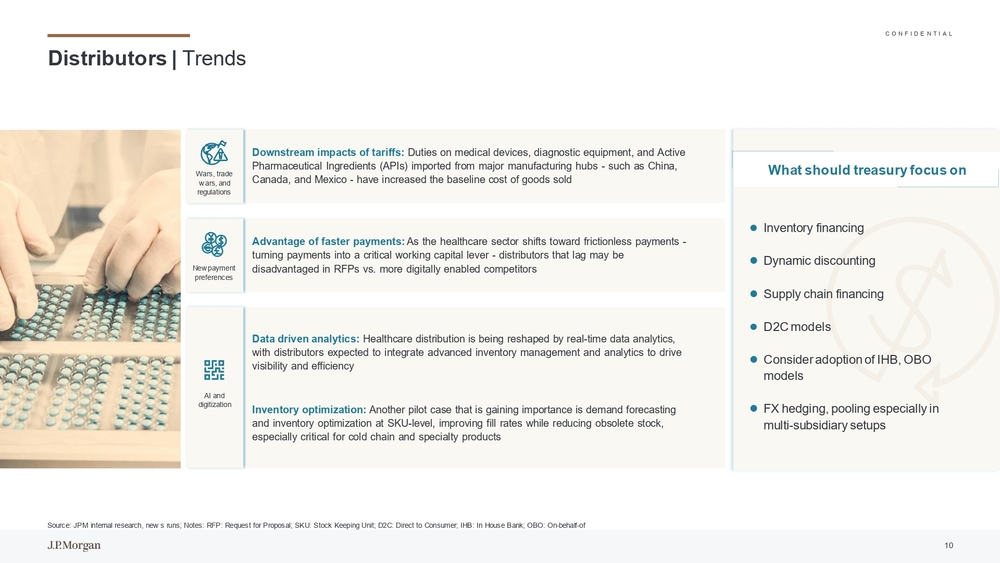
C O N F I D E N T I A L Distributors | Trends Source: JPM internal research, new s runs; Notes: RFP: Request for Proposal; SKU: Stock Keeping Unit ; D2C: Direct to Consumer; IHB: In House Bank; OBO: On -behalf -of Downstream impacts of tariffs: Duties on medical devices, diagnostic equipment, and Active Pharmaceutical Ingredients (APIs) imported from major manufacturing hubs -such as China, Canada, and Mexico -have increased the baseline cost of goods sold ⚫Inventory financing Advantage of faster payments: As the healthcare sector shifts toward frictionless payments - turning payments into a critical working capital lever -distributors that lag may be disadvantaged in RFPs vs. more digitally enabled competitors Data driven analytics: Healthcare distribution is being reshaped by real -time data analytics, with distributors expected to integrate advanced inventory management and analytics to drive visibility and efficiency Inventory optimization: Another pilot case that is gaining importance is demand forecasting and inventory optimization at SKU -level, improving fill rates while reducing obsolete stock, especially critical for cold chain and specialty products⚫Dynamic discounting ⚫Supply chain financing ⚫Consider adoption of IHB, OBO models ⚫FX hedging, pooling especially in multi-subsidiary setups Wars, trade w ars, and regulations New payment preferences AI and digitizationWhat should treasury focus on 10⚫D2C models
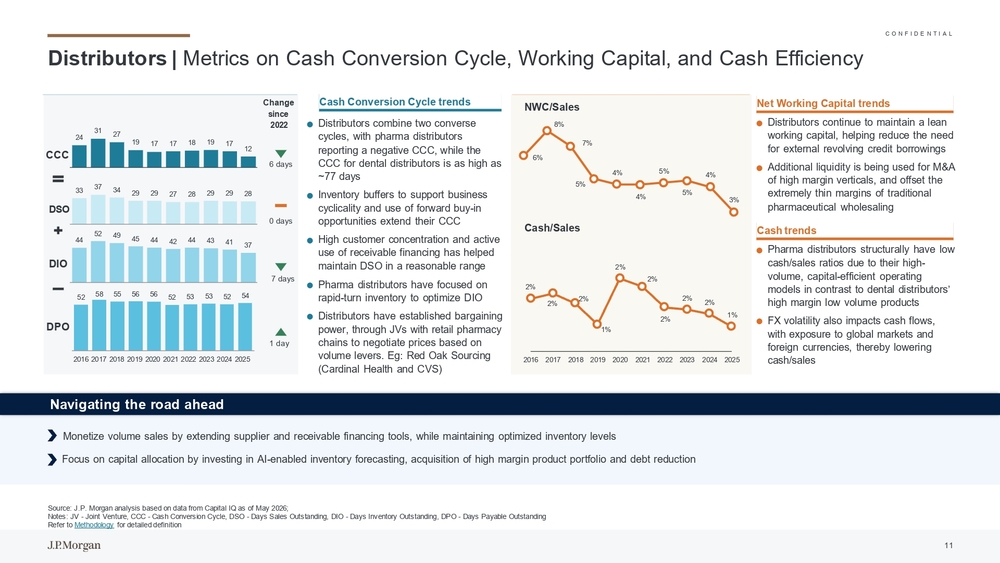
C O N F I D E N T I A L ⚫Pharma distributors structurally have low cash/sales ratios due to their high - volume, capital -efficient operating models in contrast to dental distributors’ high margin low volume products ⚫FX volatility also impacts cash flows, with exposure to global markets and foreign currencies, thereby lowering cash/sales ⚫Distributors continue to maintain a lean working capital, helping reduce the need for external revolving credit borrowings ⚫Additional liquidity is being used for M&A of high margin verticals, and offset the extremely thin margins of traditional pharmaceutical wholesalingDistributors | Metrics on Cash Conversion Cycle, Working Capital, and Cash Efficiency Source: J.P. Morgan analysis based on data from Capital IQ as of May 2026; Notes: JV -Joint Venture, CCC -Cash Conversion Cycle, DSO -Days Sales Outstanding, DIO -Days Inventory Outstanding, DPO -Days Payable Outstanding Refer to Methodology for detailed definition Navigating the road aheadChange since 2022 0days 7 days 1 day⚫Distributors combine two converse cycles, with pharma distributors reporting a negative CCC, while the CCC for dental distributors is as high as ~77 days ⚫Inventory buffers to support business cyclicality and use of forward buy -in opportunities extend their CCC ⚫High customer concentration and active use of receivable financing has helped maintain DSO in a reasonable range ⚫Pharma distributors have focused on rapid -turn inventory to optimize DIO ⚫Distributors have established bargaining power, through JVs with retail pharmacy chains to negotiate prices based on volume levers. Eg: Red Oak Sourcing (Cardinal Health and CVS)NWC/Sales Cash/Sales6%8% 7% 5%4% 4%5% 5%4% 3% 2% 2%2% 1%2% 2% 2%2%2% 1% 2016 2017 2018 2019 2020 2021 2022 2023 2024 2025 Monetize volume sales by extending supplier and receivable financing tools, while maintaining optimized inventory levels Focus on capital allocation by investing in AI -enabled inventory forecasting, acquisition of high margin product portfolio and d ebt reduction33373429 29 27 28 29 29 28 4452 4945 44 42 44 43 4137 5258 55 56 5652 53 53 52 54 2016 2017 2018 2019 2020 2021 2022 2023 2024 2025DSO DIO DPO6days243127 19 17 17 18 19 1712CCCNet Working Capital trends Cash trendsCash Conversion Cycle trends 11
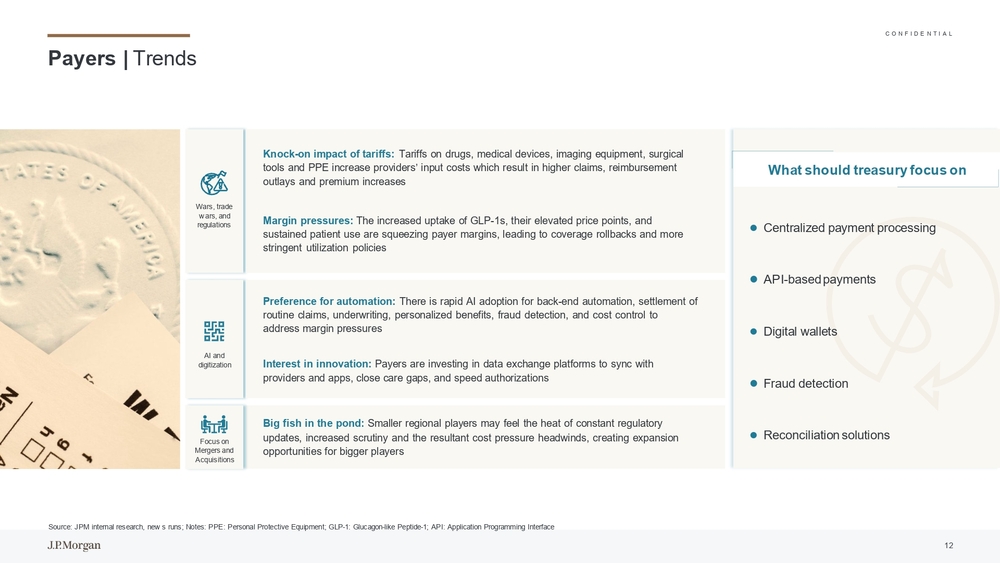
C O N F I D E N T I A L Payers | Trends ⚫Centralized payment processing ⚫Reconciliation solutions⚫API-based payments ⚫Digital wallets Source: JPM internal research, new s runs; Notes: PPE: Personal Protective Equipment; GLP -1: Glucagon -like Peptide -1;API: Application Programming Interface⚫Fraud detection Interest in innovation: Payers are investing in data exchange platforms to sync with providers and apps, close care gaps, and speed authorizationsPreference for automation: There is rapid AI adoption for back -end automation, settlement of routine claims, underwriting, personalized benefits, fraud detection, and cost control to address margin pressures Knock -on impact of tariffs: T ariffs on drugs, medical devices, imaging equipment, surgical tools and PPE increase providers’ input costs which result in higher claims, reimbursement outlays and premium increases Margin pressures: The increased uptake of GLP -1s, their elevated price points, and sustained patient use are squeezing payer margins, leading to coverage rollbacks and more stringent utilization policies Big fish in the pond: Smaller regional players may feel the heat of constant regulatory updates, increased scrutiny and the resultant cost pressure headwinds, creating expansion opportunities for bigger players What should treasury focus on Wars, trade w ars, and regulations Focus on Mergers and AcquisitionsAI and digitization 12
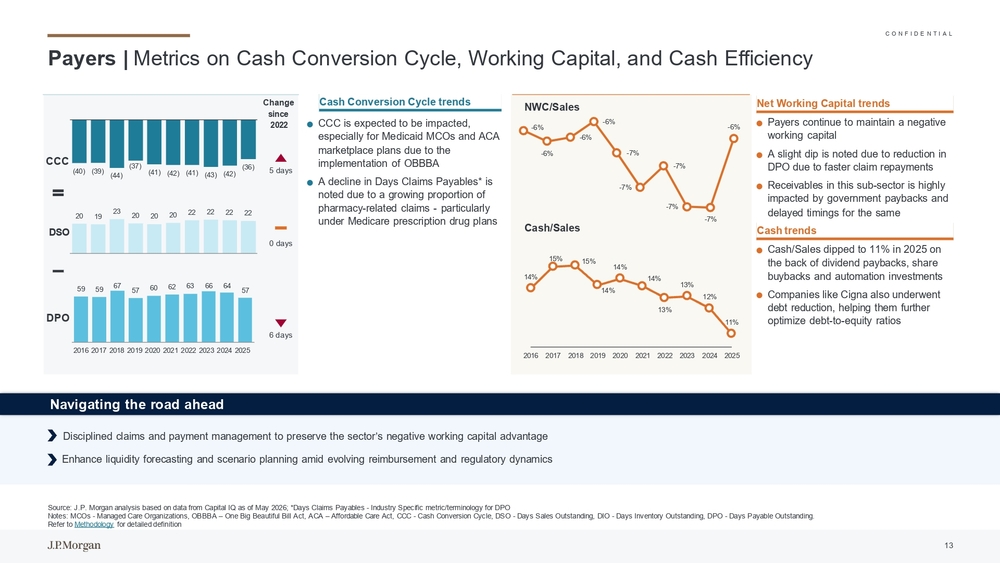
C O N F I D E N T I A L ⚫Cash/Sales dipped to 11% in 2025 on the back of dividend paybacks, share buybacks and automation investments ⚫Companies like Cigna also underwent debt reduction, helping them further optimize debt -to-equity ratios ⚫Payers continue to maintain a negative working capital ⚫A slight dip is noted due to reduction in DPO due to faster claim repayments ⚫Receivables in this sub -sector is highly impacted by government paybacks and delayed timings for the samePayers | Metrics on Cash Conversion Cycle, Working Capital, and Cash Efficiency Source: J.P. Morgan analysis based on data from Capital IQ as of May 2026; * Days Claims Payables -Industry Specific metric/terminology for DPO Notes: MCOs -Managed Care Organizations , OBBBA –One Big Beautiful Bill Act, ACA –Affordable Care Act, CCC -Cash Conversion Cycle, DSO -Days Sales Outstanding, DIO -Days Inventory Outstanding, DPO -Days Payable Outstanding. Refer to Methodology for detailed definition Navigating the road aheadChange since 2022 0days 6 days⚫CCC is expected to be impacted, especially for Medicaid MCOs and ACA marketplace plans due to the implementation of OBBBA ⚫A decline in Days Claims Payables* is noted due to a growing proportion of pharmacy -related claims -particularly under Medicare prescription drug plansNWC/Sales Cash/Sales-6% -6%-6%-6% -7% -7%-7% -7% -7%-6% 14%15%15% 14%14% 14% 13%13% 12% 11% 2016 2017 2018 2019 2020 2021 2022 2023 2024 2025 Disciplined claims and payment management to preserve the sector’s negative working capital advantage Enhance liquidity forecasting and scenario planning amid evolving reimbursement and regulatory dynamics20 192320 20 2022 22 22 22 59 59675760 62 63 66 6457 2016 2017 2018 2019 2020 2021 2022 2023 2024 2025DSO DPO5days (40) (39)(44)(37) (41) (42) (41)(43) (42)(36)CCCNet Working Capital trends Cash trendsCash Conversion Cycle trends 13
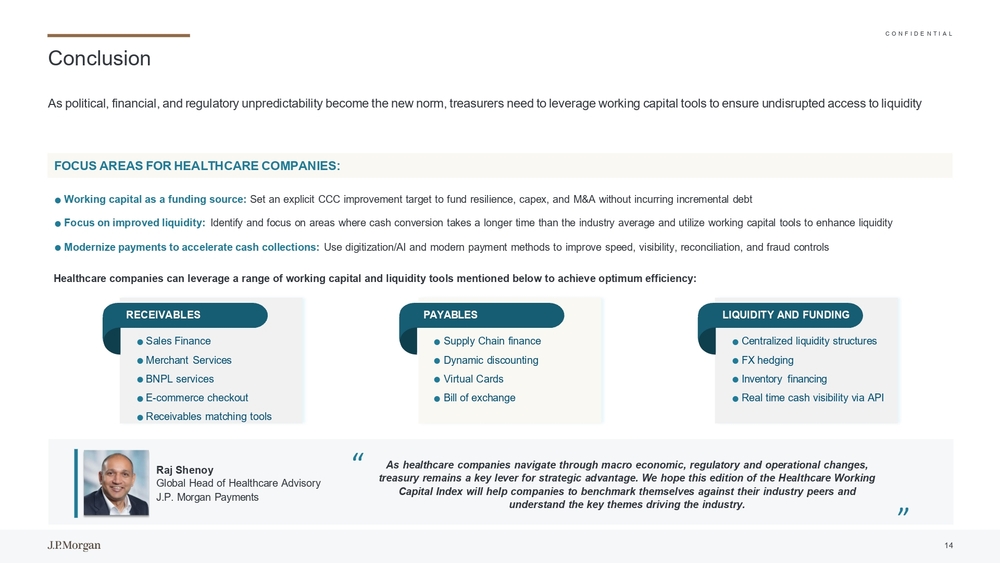
C O N F I D E N T I A L As political, financial, and regulatory unpredictability become the new norm, treasurers need to leverage working capital too ls to ensure undisrupted access to liquidity Healthcare companies canleverage arange ofworking capital andliquidity tools mentioned below toachieve optimum efficiency :Conclusion ⚫Working capital as a funding source: Set an explicit CCC improvement target to fund resilience, capex, and M&A without incurring incremental debt ⚫Focus on improved liquidity: Identify and focus on areas where cash conversion takes a longer time than the industry average and utilize working capital t ools to enhance liquidity ⚫Modernize payments to accelerate cash collections: Use digitization/AI and modern payment methods to improve speed, visibility, reconciliation, and fraud controlsFOCUS AREAS FOR HEALTHCARE COMPANIES: ⚫Centralized liquidity structures ⚫FX hedging ⚫Inventory financing ⚫Real time cash visibility via APILIQUIDITY AND FUNDING ⚫Supply Chain finance ⚫Dynamic discounting ⚫Virtual Cards ⚫Bill of exchangePAYABLES ⚫Sales Finance ⚫Merchant Services ⚫BNPL services ⚫E-commerce checkout ⚫Receivables matching toolsRECEIVABLES “As healthcare companies navigate through macro economic, regulatory and operational changes, treasury remains a key lever for strategic advantage. We hope this edition of the Healthcare Working Capital Index will help companies to benchmark themselves against their industry peers and understand the key themes driving the industry. “ Raj Shenoy Global Head of Healthcare Advisory J.P. Morgan Payments 14
C O N F I D E N T I A L About Global Advisory | Healthcare Practice OurGlobal Advisory team, within J.P.Morgan Payments, partners with treasury andfinance leaders helping them optimize treasury, payments, liquidity, and working capital bydelivering strategic guidance, market intelligence, anddata-driven insights .Comprised offormer practitioners, strategy consultants, andbankers with deep domain andindustry expertise ;weoffer Global coverage with regional execution . J.P.Morgan Payments -J.P.Morgan isatrusted partner inPayments, supporting clients across industries andacross theglobe withcomprehensive payments solutions tailored totoday's evolving business landscape .Backed byover 200 years ofheritage, innovation, and scale, wecombine global reach with deep industry knowledge tohelp organizations navigate complexity, manage risk, andunlock new efficiencies -enabling them tostay ahead inadynamic market environment .Learn more about how we can support your business: Click here to connect with the Global Advisory team now 15 Raj Shenoy Global Head of Healthcare Advisory J.P. Morgan Payments Singapore Rohan Laghate Advisory Research & Analytics J.P. Morgan Payments MumbaiContacts Priyanka Pujari Advisory Research & Analytics J.P. Morgan Payments Mumbai Ivan Kotev Global Advisory J.P. Morgan Payments London James McKenzie Global Advisory J.P. Morgan Payments New Y ork

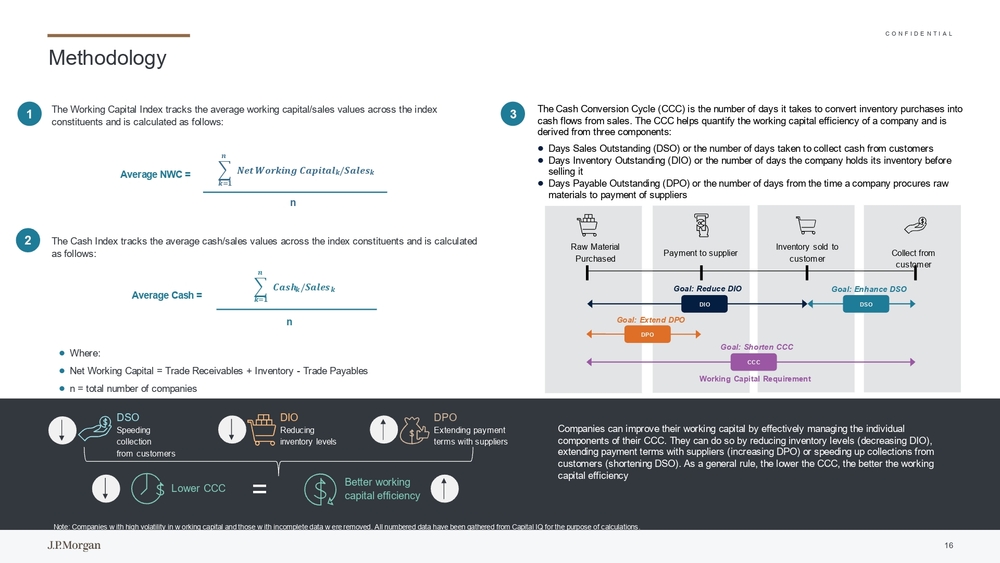
C O N F I D E N T I A L ⚫Where: ⚫Net Working Capital = Trade Receivables + Inventory -Trade Payables ⚫n = total number of companies n 𝒌=𝟏𝒏 𝑵𝒆𝒕𝑾𝒐𝒓𝒌𝒊𝒏𝒈 𝑪𝒂𝒑𝒊𝒕𝒂𝒍 𝒌/𝑺𝒂𝒍𝒆𝒔𝒌 Average NWC = 𝒌=𝟏𝒏 𝑪𝒂𝒔𝒉𝒌/𝑺𝒂𝒍𝒆𝒔𝒌 nAverage Cash = DPODIO DSO CCC Working Capital RequirementRaw Material PurchasedCollect from customer Payment to supplierInventory sold to customer Goal: Extend DPOGoal: Reduce DIO Goal: Enhance DSO Goal: Shorten CCCThe Working Capital Index tracks the average working capital/sales values across the index constituents and is calculated as follows: The Cash Index tracks the average cash/sales values across the index constituents and is calculated as follows:The Cash Conversion Cycle (CCC) is the number of days it takes to convert inventory purchases into cash flows from sales. The CCC helps quantify the working capital efficiency of a company and is derived from three components: ⚫Days Sales Outstanding (DSO) or the number of days taken to collect cash from customers ⚫Days Inventory Outstanding (DIO) or the number of days the company holds its inventory before selling it ⚫Days Payable Outstanding (DPO) or the number of days from the time a company procures raw materials to payment of suppliers1 23Methodology Companies can improve their working capital by effectively managing the individual components of their CCC. They can do so by reducing inventory levels (decreasing DIO), extending payment terms with suppliers (increasing DPO) or speeding up collections from customers (shortening DSO). As a general rule, the lower the CCC, the better the working capital efficiency Note: Companies w ith high volatility in w orking capital and those w ith incomplete data w ere removed. All numbered data have b eengathered from Capital IQ for the purpose of calculations.DSO Speeding collection from customersDIO Reducing inventory levelsDPO Extending payment terms with suppliers Lower CCCBetter working capital efficiency = 16
C O N F I D E N T I A L Disclaimer This material w as prepared exclusively for the benefit and internal use of the JPMorgan client to w hom it is directly address ed (including such client’s subsidiaries, the “Company”) in order to assist the Company in evaluating a possible transaction(s) anddoes not carry any right of disclosure to any other party. In preparing this material, w e have relied upon and assumed, w ithout independent verification, the accura cy and completeness of all information available from public sources or w hich was provided to us by or on behalf of the Company or w hich was otherwise reviewed by us. This material is for discussion purposes only and is incomplete w ithout reference to the other briefings provided by JPMo rgan. Neither this material nor any of its contents may be disclosed or used for any other purpose w ithout the prior w ritten con sent of JPMorgan. This material is not intended to provide legal, tax, investment, accounting, financial, business, real estate, technology or other advice, and should not be used for or relied upon for these purposes. The view s, opinions, estimates and strategies expres sedin this material are those of the respective individual contributors, authors or speakers, and may differ from those of JPMorganChase, or its employees and aff iliates. Any market and/or economic commentary in this material in no w ay constitutes JPMorganChase research and should not be t reated as such. Further, the view s expressed in this content may differ from those contained in JPMorganChase research reports. The content in this materi al has been obtained from sources deemed to be reliable, but JPMorganChase makes no representation or w arranty as to its accurac y or completeness. In no event shall JPMorganChase nor any of its directors, officers, employees or agents be liable for any use of, for any decision made or action taken in reliance upon, or for any inaccuracies or errors in or omissions from, this material. J.P.Morgan, JPMorgan, JPMorgan Chase, Chase, Chase Merchant Services, and Chase Payment Solutions are marketing names for certa in businesses of JPMorgan Chase & Co. and its subsidiaries w orldwide (collectively, “JPMC”). Products or services may be mark eted and/or provided by commercial banks such as JPMorgan Chase Bank, N.A., securities or other non -banking affiliates or other JPMC entities. JPMC c ontact persons may be employees or officers of any of the foregoing entities and the terms “J.P. Morgan”, “JPMorgan”, “JPMorgan Chase”, “Chase”, “Chase Merchant Services” and “Chase Payment Solutions” if and as used herein include as applicable all such employees or officers a nd/or entities irrespective of marketing name(s) used. Nothing in this material is a solicitation by JPMC of any product or serv icewhich would be unlaw ful under applicable law s or regulations. Investments or strategies discussed herein may not be suitable for all investors. Neither JPMorgan nor any of its directors, officers, employees or agents shall incur in any responsibility or liability w hatsoever to the Company or any other party w ith r espect to the contents of any matters referred herein, or discussed as a result of, this material. This material is not intended to provide, and should not be reli ed on for, accounting, legal or tax advice or investment recommendations. Please consult your ow n tax, legal, accounting or inve stment advisor concerning such matters. Not all products and services are available in all geographic areas. Eligibility for particular products and services is subj ectto final determination by JPMC and or its affiliates. This material does not constitute a commitment by any JPMC entity to ex tend or arrange credit or to provide any other products or services and JPMorgan reserves the right to w ithdraw at any time. All products and services are subject to applicable law s, regulations, and applicable approvals and notifications. The Company should examine the specific restrictions a nd limitations under the law s of its ow n jurisdiction that may be applicable to the Company due to its nature or to the products and services referred herein. Any mentions of third -party trademarks, brand names, products and services are for referential purposes only and any mention the reof is not meant to imply any sponsorship, endorsement, or affiliation. Notw ithstanding anything to the contrary, the statements in this material are not intended to be legally binding. Any product s, services, terms or other matters described herein (other than in respect of confidentiality) are subject to, and superseded b y, the terms of separate legally binding documentation and/or are subject to change w ithout notice. Changes to Interbank Offered Rates (IBORs) and other benchmark rates: Certain interest rate benchmarks are, or may in the fut urebecome, subject to ongoing international, national and other regulatory guidance, reform and proposals for reform. For more i nformation, please consult: https://www.jpmorgan.com/global/disclosures/interbank_offered_rates . JPMorgan Chase Bank, N.A. Member FDIC. Deposits held in non -U.S. branches are not FDIC insured. Non -deposit products are not FDI C insured. JPMorgan Chase Bank, N.A., organized under the law s of U.S.A. w ith limited liability. © 2026 JPMorgan Chase & Co. All Rights Reserved. 17