climate-intuition-tipping-points
by JPMorgan
1 Tipping Points: Decision making under deep uncertainty
2 Executive Summary: Tipping Points Climate decision-making requires acting on long-term scientific signals with imperfect estimates of financial and societal impact, sometimes well before markets fully price in the risks. Leaders make strategic choices under this uncertainty, which may only become visible to the broader market years later. A common question I get from board members or executives: What do the next five years look like, for me, in my job? For context, across the S&P 500, the average CEO has a tenure of 7.6 years and average board of directors member has a tenure of 7.8 years.i Investors can have longer tenure in their roles, but not much.ii While those corporate leaders make decisions today that may affect the future of their business beyond their tenure, they will not necessarily navigate through an 8-year-plus future world in their current seat. They want to know how the climate will change and how it will flow through their daily work life. It requires translating climate science into direct impacts within their specific time horizon (<8 years). However, it also requires thinking how perceptions of the future may shift as more is known in climate science and markets price in both cumulative and future climate change. In essence, what they want to do is make sure they time the (climate) market. There’s no question that climate change will have business impacts. Physical climate risk is beginning to affect insurance markets,iii , utilities within wildfire zonesiv, and real estatev. But not all change may be gradual. Low-probability but potentially abrupt “climate tipping point” shifts could reshape risks and opportunities rapidly. These climate black swan risks may be unlikely but highly consequential, with considerable uncertainty about when or how quickly they could materialize. For these nonlinear changes, timelines of executive tenure and currently projected change are mismatched, which impedes effective long-term decision-making. These climate tipping points have emerged as a phenomenon of concern but also deep uncertainty and scientific debate in recent years. We need to try to bridge this gap to truly prepare businesses for deeply consequential climate events that may occur against highly uncertain timelines. Nevertheless, elements of tipping point risk are beginning to be incorporated into certain decisions for capital allocation and investment strategy. This report dives into climate tipping points, what they are, who is pricing them in, and how to make decisions under deep uncertainty. In short, while the Climate Intuition series recommends prioritizing resilience planning for physical risk and decarbonization, one should treat tipping points as potentially impactful but under-modeled. Just because an event is improbable does not mean it is impossible. The lack of historic analogs and abrupt, nonlinear and uncertain nature of tipping points makes them difficult to plan for against more routine volatility risks. Scenarios and tabletop exercises, borrowed from other spheres of decision-making under deep uncertainty, can help prepare for new science or emerging shifts. The table below helps us think through different actors and their objectives that might lead to potential actions they can take on climate tipping points. Book suggestions have been added, which may seem counterintuitive to other reports we’ve published. At recent board meetings, people have asked where they can read more, fiction or nonfiction, to explore different future scenarios to understand how to plan for an uncertain future. Dr Sarah Kapnick Global Head of Climate Advisory, Commercial & Investment Bank, J.P. Morgan Acknowledgements: Ligia Deschamps, Isabel Ernst, Andrew Tan for supporting the development of data and graphics. Cathy Ansell, Marilyn Ceci, Sunny Qiao for careful review and comments.
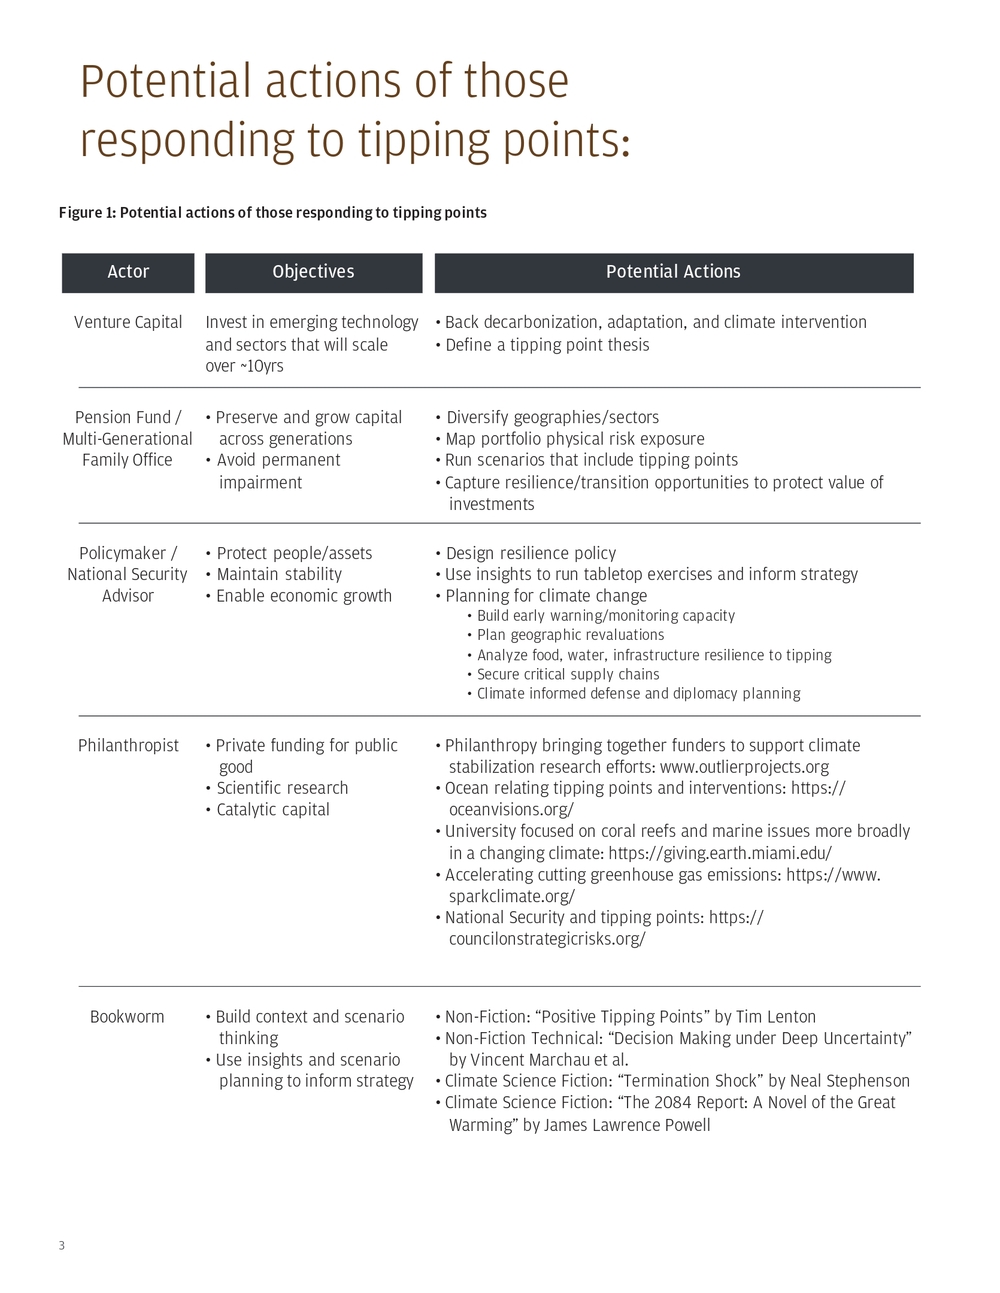
3Potential actions of those responding to tipping points: Actor Venture Capital Pension Fund / Multi-Generational Family Office BookwormPolicymaker / National Security Advisor PhilanthropistInvest in emerging technology and sectors that will scale over ~10yrs • Preserve and grow capital across generations • Avoid permanent impairment • Build context and scenario thinking • Use insights and scenario planning to inform strategy• Protect people/assets • Maintain stability • Enable economic growth • Private funding for public good • Scientific research • Catalytic capital• Back decarbonization, adaptation, and climate intervention • Define a tipping point thesis • Diversify geographies/sectors • Map portfolio physical risk exposure • Run scenarios that include tipping points • Capture resilience/transition opportunities to protect value of investments • Non-Fiction: “Positive Tipping Points” by Tim Lenton • Non-Fiction Technical: “Decision Making under Deep Uncertainty” by Vincent Marchau et al. • Climate Science Fiction: “Termination Shock” by Neal Stephenson • Climate Science Fiction: “The 2084 Report: A Novel of the Great Warming” by James Lawrence Powell• Design resilience policy • Use insights to run tabletop exercises and inform strategy • Planning for climate change • Build early warning/monitoring capacity • Plan geographic revaluations • Analyze food, water, infrastructure resilience to tipping • Secure critical supply chains • Climate informed defense and diplomacy planning • Philanthropy bringing together funders to support climate stabilization research efforts: www.outlierprojects.org • Ocean relating tipping points and interventions: https:// oceanvisions.org/ • University focused on coral reefs and marine issues more broadly in a changing climate: https://giving.earth.miami.edu/ • Accelerating cutting greenhouse gas emissions: https://www. sparkclimate.org/ • National Security and tipping points: https:// councilonstrategicrisks.org/ Objectives Potential ActionsFigure 1: Potential actions of those responding to tipping points
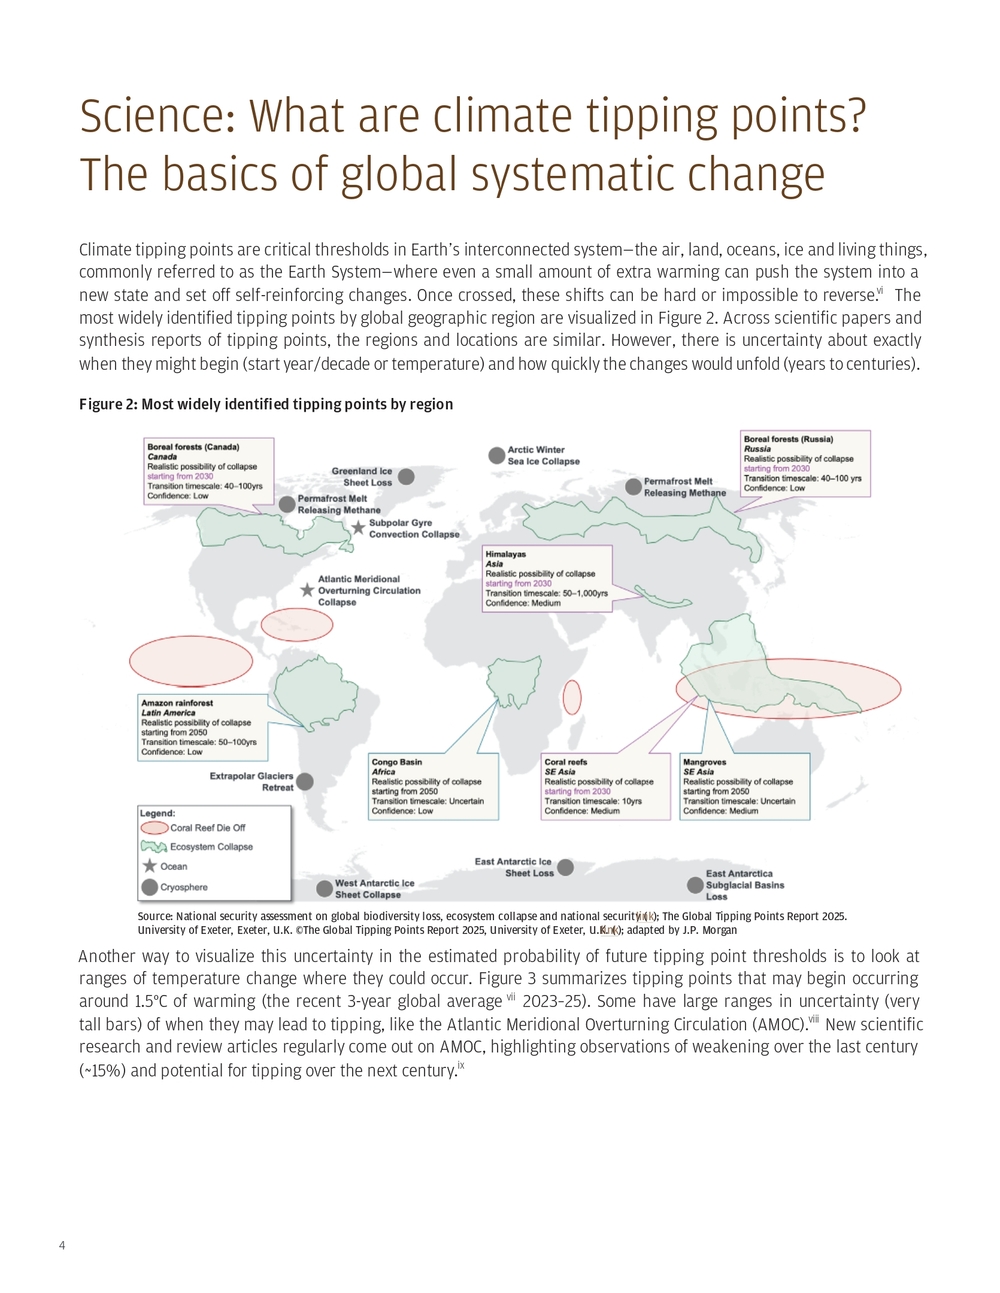
4Science: What are climate tipping points? The basics of global systematic change Climate tipping points are critical thresholds in Earth’s interconnected system—the air, land, oceans, ice and living things, commonly referred to as the Earth System—where even a small amount of extra warming can push the system into a new state and set off self-reinforcing changes. Once crossed, these shifts can be hard or impossible to reverse.vi The most widely identified tipping points by global geographic region are visualized in Figure 2. Across scientific papers and synthesis reports of tipping points, the regions and locations are similar. However, there is uncertainty about exactly when they might begin (start year/decade or temperature) and how quickly the changes would unfold (years to centuries). Another way to visualize this uncertainty in the estimated probability of future tipping point thresholds is to look at ranges of temperature change where they could occur. Figure 3 summarizes tipping points that may begin occurring around 1.5°C of warming (the recent 3-year global averagevii 2023–25). Some have large ranges in uncertainty (very tall bars) of when they may lead to tipping, like the Atlantic Meridional Overturning Circulation (AMOC).viii New scientific research and review articles regularly come out on AMOC, highlighting observations of weakening over the last century (~15%) and potential for tipping over the next century.ix Figure 2: Most widely identified tipping points by region Source: National security assessment on global biodiversity loss, ecosystem collapse and national security ( link); The Global Tipping Points Report 2025. University of Exeter, Exeter, U.K. ©The Global Tipping Points Report 2025, University of Exeter, U.K. ( link); adapted by J.P. Morgan
5These shifts fall into three main areas: (1) ecosystem collapse, where current ecosystems are no longer viable in present- day locations; (2) changes in major ocean currents that move heat, nutrients and water from one region to another; (3) cryosphere loss, where sea ice, glacier ice (land ice), permafrost (soil ice) and snow are no longer present. On the Brink: Coral Reefs, Commercial Fisheries, Tourism, and Coastal Erosion Coral reefs are already exhibiting a shift under the stress of ocean warming coupled with ocean heat waves that make temperatures spike higher than the average, especially during El Niño periods. When pushed beyond their ideal temperature range, corals “bleach” where they expel their microscopic colorful algae, leaving a white skeleton behind. The algae can return if temperatures cool, but as heatwaves extend (or background temperatures warm), the likelihood of algae return decreases. The algae helps generate food for corals; if they don’t return, the coral tissue starves and dies.x This leads to coral die off and extinction. In 1998 and <1°C of background warming, the first global bleaching occurred. Over 21% of reefs worldwide were under bleaching-level stress. Recently, during the largest bleaching event worldwide, 84% of corals globally bleached from January 2023 to September 2025, more than any prior bleaching event.xii Even cautious forecasts suggest that by 2050, most coral reefs around the world could experience severe bleaching every year (i.e. even without an El Niño).xiii Another El Niño is potentially brewing,xiv which will bring this issue back in the news as another ocean heatwave would not give corals much time to recover between bleaching events. Corals matter; they serve as nurseries for young marine species, supporting an estimated 25% of all marine life at some point in their life cycle.xv Lose the corals and you lose the marine life dependent on them. Coral reef loss is expected to degrade commercial fisheries and tourism along the ocean and to increase erosion rates along the coast as corals act as sponges of wave strength before they hit the shore. In short, coral reef ecosystem collapse isn’t theoretical; species are already becoming functionally extinct in their historic watersxvi and those remaining are already under regular stress. This tipping point is unique in its geographic concentration and nearer-term impact, increasing local urgency to respond. Commercial sectors and communities dependent on them are on the precipice of finding out what happens as the first tipping point shifts. A prudent decision-maker will conduct risk assessments even if action is not taken. Actionable steps to reduce risk include diversification of exposure before tipping and targeted resilience and adaptation investments to safeguard livelihoods and asset values. Figure 3: Ranges of temperatures that may catalyze tipping points, starting ~1.5°C Source: © 2025 International Coral Reef Initiative (ICRI) ( link); Figure created by J.P. Morgan Source: The Global Tipping Points Report 2025. University of Exeter, Exeter, U.K. ©The Global Tipping Points Report 2025, University of Exeter, U.K. ( link), adapted by J.P. Morgan 21%37%68%84% 0%10%20%30%40%50%60%70%80%90%100% 1995 2000 2005 2010 2015 2020 20251998 Bleaching event 2010 Bleaching event 2014-2017 Bleaching event 2023-2025 Bleaching event Figure 4: % of global reefs affected by bleaching-level heat stress
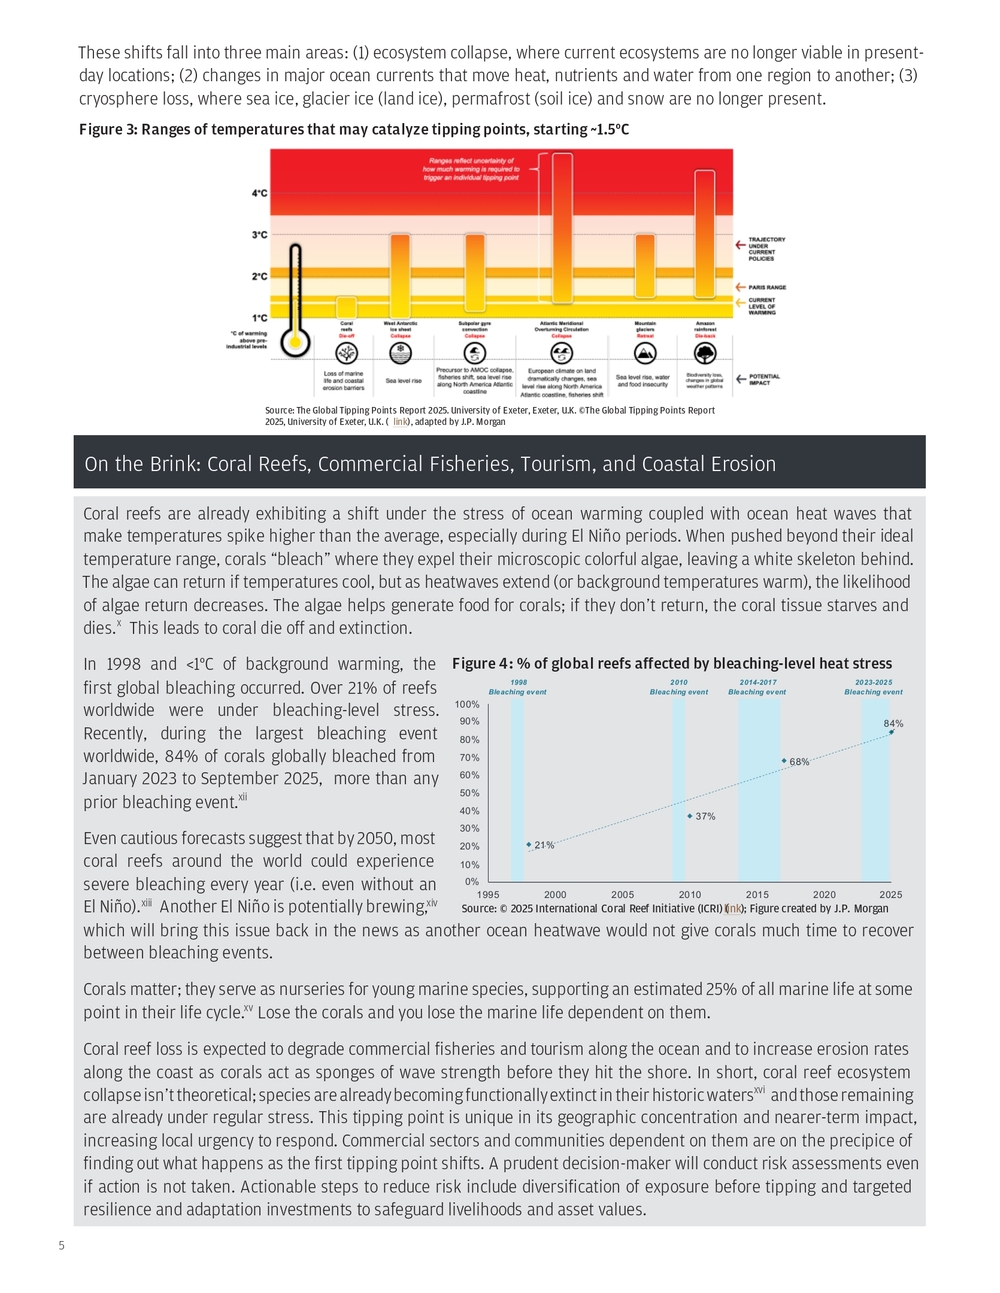
6After a tipping point starts to occur, the speed of change toward a new climate state is not necessarily linear and can accelerate or decelerate due to something known as a “positive feedback loop” or a “negative feedback loop.” For example, as greenhouse gases accumulate in the atmosphere, temperatures rise and snow and sea ice decline. The darker land and water that emerge absorb more sunlight, accelerating local warming and melting. These feedbacks are increasing spring warming as snow and ice disappear earlier. They also add uncertainty about how fast warming may proceed and how systems may respond as tipping points are crossed. Ultimately, the rapid changes in regional and global climate and access to resources brought about by tipping points (e.g., sea level rise, collapsed ecosystems, water availability, extreme heat, food productivity, infrastructure degradation) could lead to far-reaching social responses including migration, conflict and geopolitical instability.xviii These are low -probability, high-impact tail risks without modern precedents.xix Speed matters: Rapid shifts can push systems past tipping points faster than society can adapt, disrupting society, ecological health (especially food production) and security. Under crisis, the cost of capital can spike, making adaptation more costly than if done proactively to mitigate damage (i.e., there is a return on investment of adaptation in advance of a crisiisxvii). Climate feedbacks spread impacts beyond where they start, adding complexity. Social responses can also present nonlinear and competing feedbacks, amplifying or reducing concern, awareness or response.TakeawayFigure 5: Feedback loop schematic: positive (self-reinforcing) and negative (self-limiting) Positive feedback loops continue until a tipping point is reached when the system equilibrium shifts Source: J.P. Morgan NEGATIVE FEEDBACK LOOP Warmer air holds more moisture, leading to increased evaporation 2 3 Clouds reflect incoming solar radiation back into space Global warming increases1 Net cooling effect slows the initial warming trend 4 POSITIVE FEEDBACK LOOP Increased heat leads to the melting of highly reflective sea ice and snow2 3 White ice disappears, exposing the dark ocean surface, which absorbs more solar radiation Global warming increases1 Absorbed heat leads to increased global warming 4
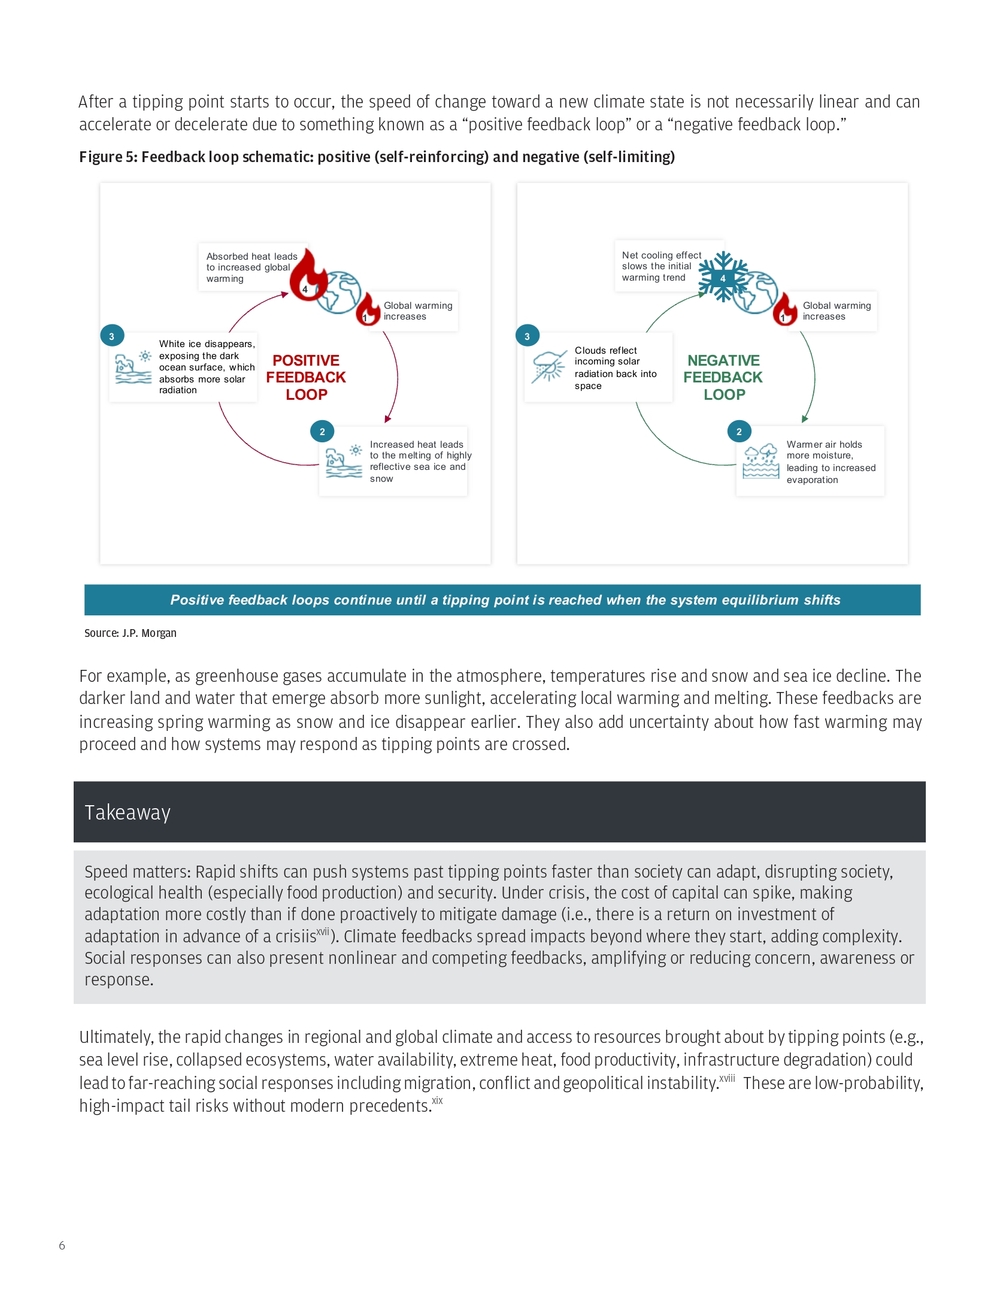
7Help me understand what I can do: decision making under deep uncertainty Differentiating global versus local impacts and responses Frameworks for accounting for tipping points are starting to emerge, but the art of translation from climate science into practical use is in early stages. Some tipping points are so systematic and far reaching that financial preparation at the portfolio level is less relevant, as they would represent fundamental shifts across entire markets unfolding over decades with societal uncertainty layered on top of climate science uncertainty. In contrast, tipping points like coral reef loss or sea level rise are less globally systemic but can have significant localized impacts, especially for concentrated portfolios by geography or commodity. This is where investors can take concrete actions. For example, once sea level rise passes a certain threshold, high tide (also known as nuisance day flooding) can increase rapidly, as baseline sea levels exceed ground thresholds, leading to regular flooding. This can render coastal infrastructure inoperable and requires advanced resilience planning and investment for multi-year resilience construction.xx This section works to take the science of Section One and translate it into different frameworks for assessing tipping point exposures and remediation. Tipping points are abstract due to (a) their time horizon uncertainty, (b) shifts between states may be too fast for adaptation measures and the (c) lack of analogs to understand their social, financial and national security impacts. To be clear: For the purposes here, we will use a definition of tipping points representing a subset of physical, biological and chemical Earth System risks brought about by climate change. This definition characterizes tipping points by their nonlinear, potentially irreversible and systematic nature. The deep uncertainty of tipping points complicates projecting their influence and decision-making. There are different approaches to trying to conceptualize tipping point risks and how to respond.Figure 6: Separating linear from nonlinear climate risks: physical climate versus climate tipping points Source: J.P. Morgan
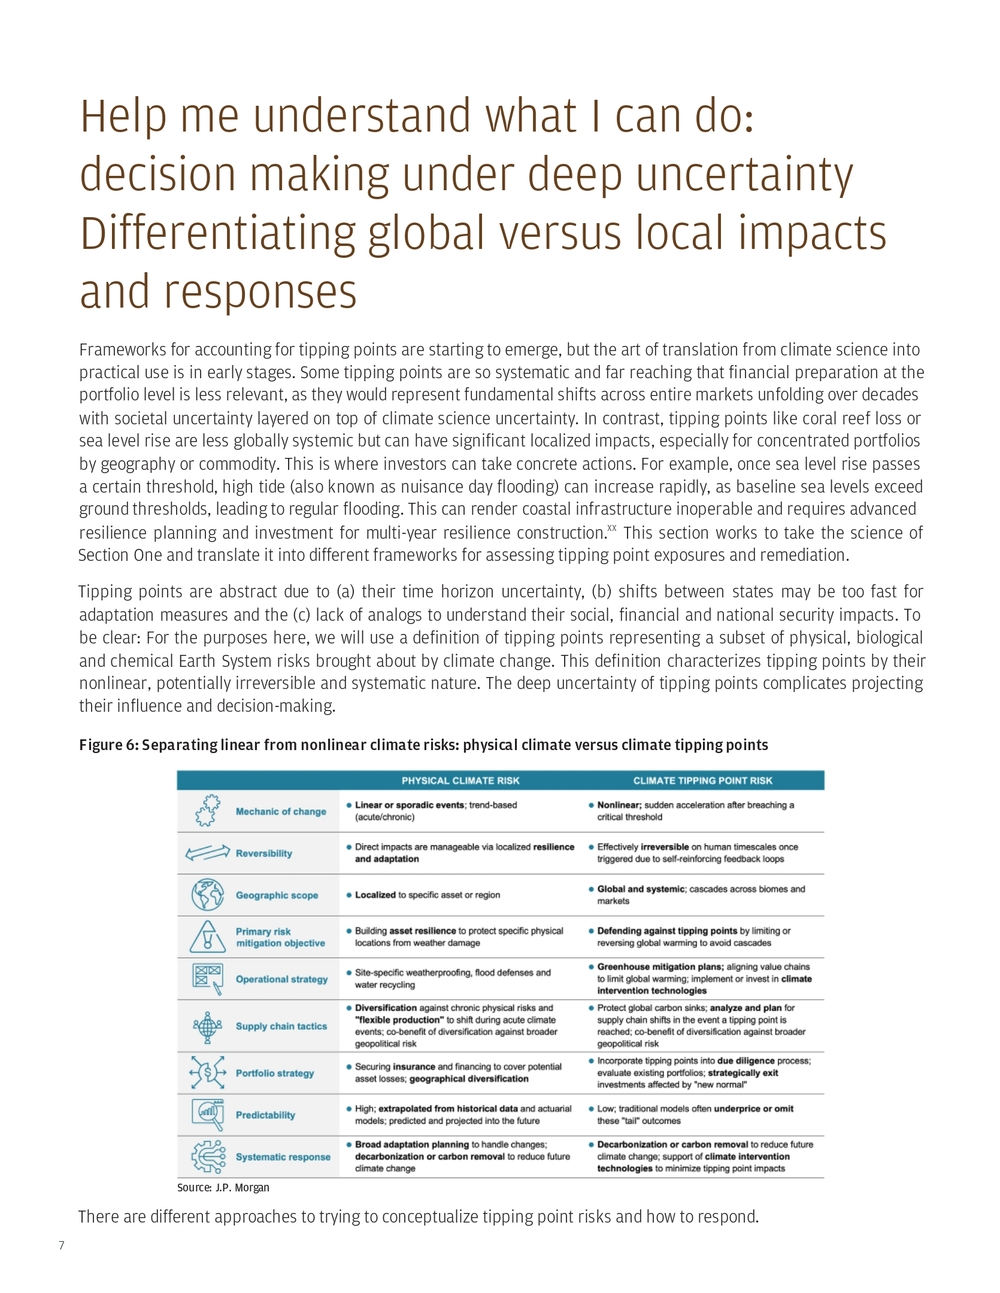
8We provide 3 scenarios to illustrate physical risk versus tipping point losses in a discounted cash flow (DCF) analysis: (1) Base case where loss events have a steady risk of happening (2) Climate drift where losses increase by a 0.75% climate change induced linear growth annually on top of (1) (3) Tipping point where there is a fundamental shift in loss probabilities after a tipping point on top of a climate drift environment from (2) Losses until tipping are the same in a steady climate change scenario and pre-tipping point. A physical climate change strategy works for both scenarios in the beginning. However, losses can increase dramatically after a tipping point is reached (here assumed rapidly). The change in losses is most acute for the most rare events (1/500) that shift to becoming more commonplace, dramatically altering risk profiles. As with all DCF analyses, discount rate assumptions can blunt expected losses in valuation today. The cumulative risk of an event jumps significantly after tipping with annual risk increasing. 1. Focusing on losses—Analyze tipping points versus steady climate change as a cash loss risk in a discounted cash flow analysis. A common recommendation of Climate Intuition: Consider climate change. A stable base case derived from historic data will misprice exposures over longer time horizons due to climate drift. The gap widens over time under scenarios of linear climate change. Maintaining the status quo ignores these gradual but predictable changes. Here the lesson is that accounting for linear assumptions of climate change may not be sufficient on a long enough time horizon. For certain climate exposures and geographies, if you’re looking far out enough, you also need to plan for nonlinear changes from tipping points. This means exploring scenarios with abrupt, step-changes rather than smooth trends. For this DCF analysis, costs shift only from the tipping point itself, requiring quick action to avoid further loss. Climate is often modeled as a risk first. The above analysis is a loss at one point in time. This DCF approach models tipping points in terms of losses, but not revenues. As awareness or expectations of a tipping point evolve, revenues can also shift as customer preferences, technology adoption and regulatory environments change. This repricing can occur before a shift in costs from an actual event. A full tipping point may also eliminate future value by zeroing out the perpetuity of revenue generation from a single source. For example, coral reef collapse will zero out boat charter revenues from snorkeling and fishing reliant on coral reefs.Figure 7: Tipping points vs. steady climate change vs. no change base case as a cash loss risk in a discounted cash flow analysis TakeawaySource: J.P. Morgan | Note: Assumes damage value grows at a 3% per year (2% inflation and 1% increase due to increase in flood severity); ¹ Includes both asset damage and business-interruption costs; ² Cumulative risk approaches 100%
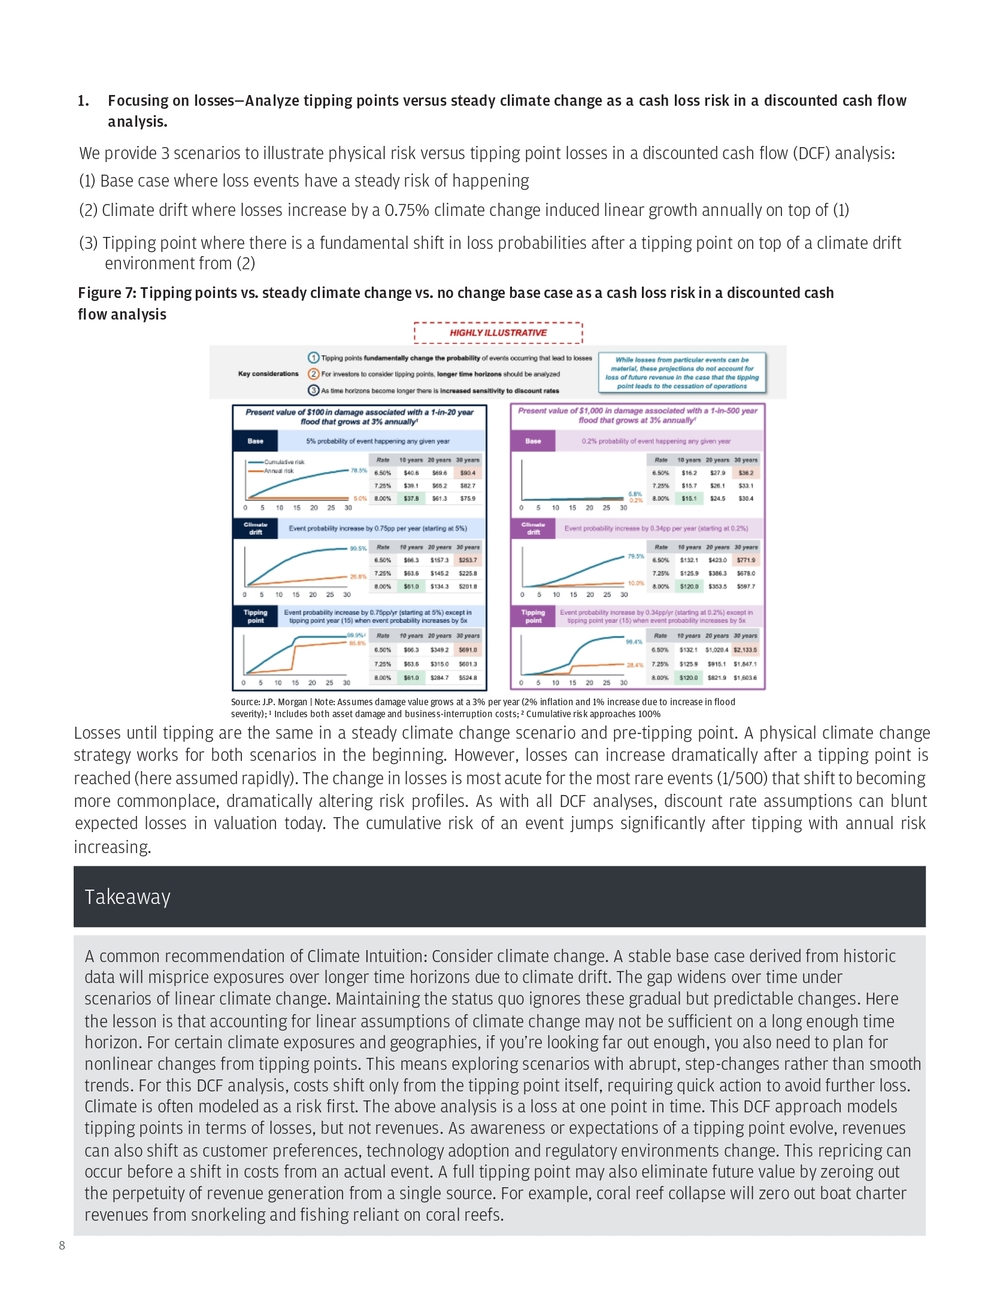
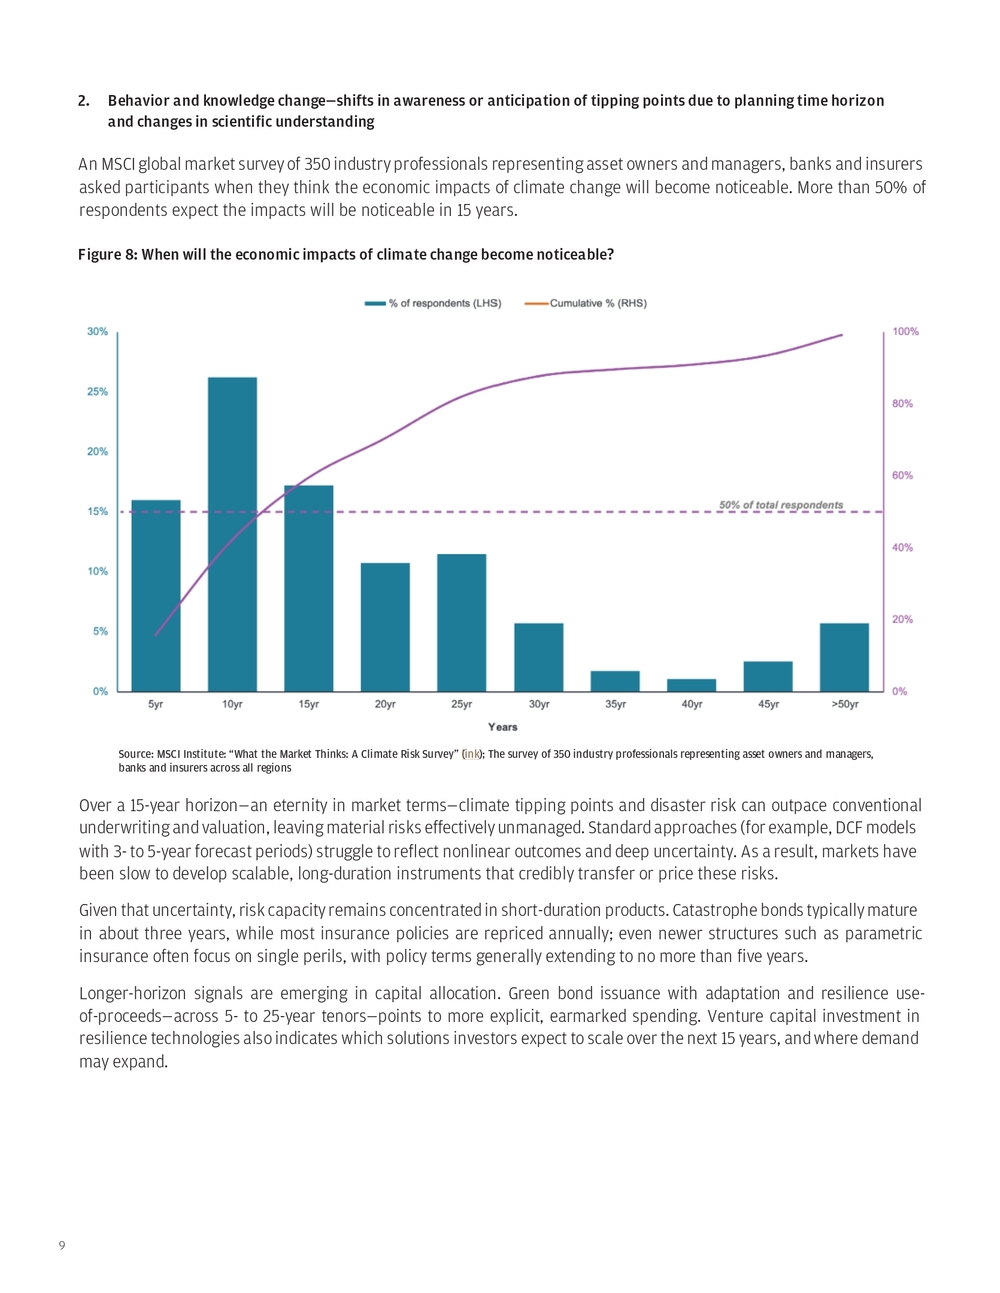
9An MSCI global market survey of 350 industry professionals representing asset owners and managers, banks and insurers asked participants when they think the economic impacts of climate change will become noticeable. More than 50% of respondents expect the impacts will be noticeable in 15 years. Over a 15-year horizon—an eternity in market terms—climate tipping points and disaster risk can outpace conventional underwriting and valuation, leaving material risks effectively unmanaged. Standard approaches (for example, DCF models with 3- to 5-year forecast periods) struggle to reflect nonlinear outcomes and deep uncertainty. As a result, markets have been slow to develop scalable, long-duration instruments that credibly transfer or price these risks. Given that uncertainty, risk capacity remains concentrated in short-duration products. Catastrophe bonds typically mature in about three years, while most insurance policies are repriced annually; even newer structures such as parametric insurance often focus on single perils, with policy terms generally extending to no more than five years. Longer-horizon signals are emerging in capital allocation. Green bond issuance with adaptation and resilience use- of-proceeds—across 5- to 25-year tenors—points to more explicit, earmarked spending. Venture capital investment in resilience technologies also indicates which solutions investors expect to scale over the next 15 years, and where demand may expand.2. Behavior and knowledge change—shifts in awareness or anticipation of tipping points due to planning time horizon and changes in scientific understanding Figure 8: When will the economic impacts of climate change become noticeable? Source: MSCI Institute: “What the Market Thinks: A Climate Risk Survey” ( link); The survey of 350 industry professionals representing asset owners and managers, banks and insurers across all regions
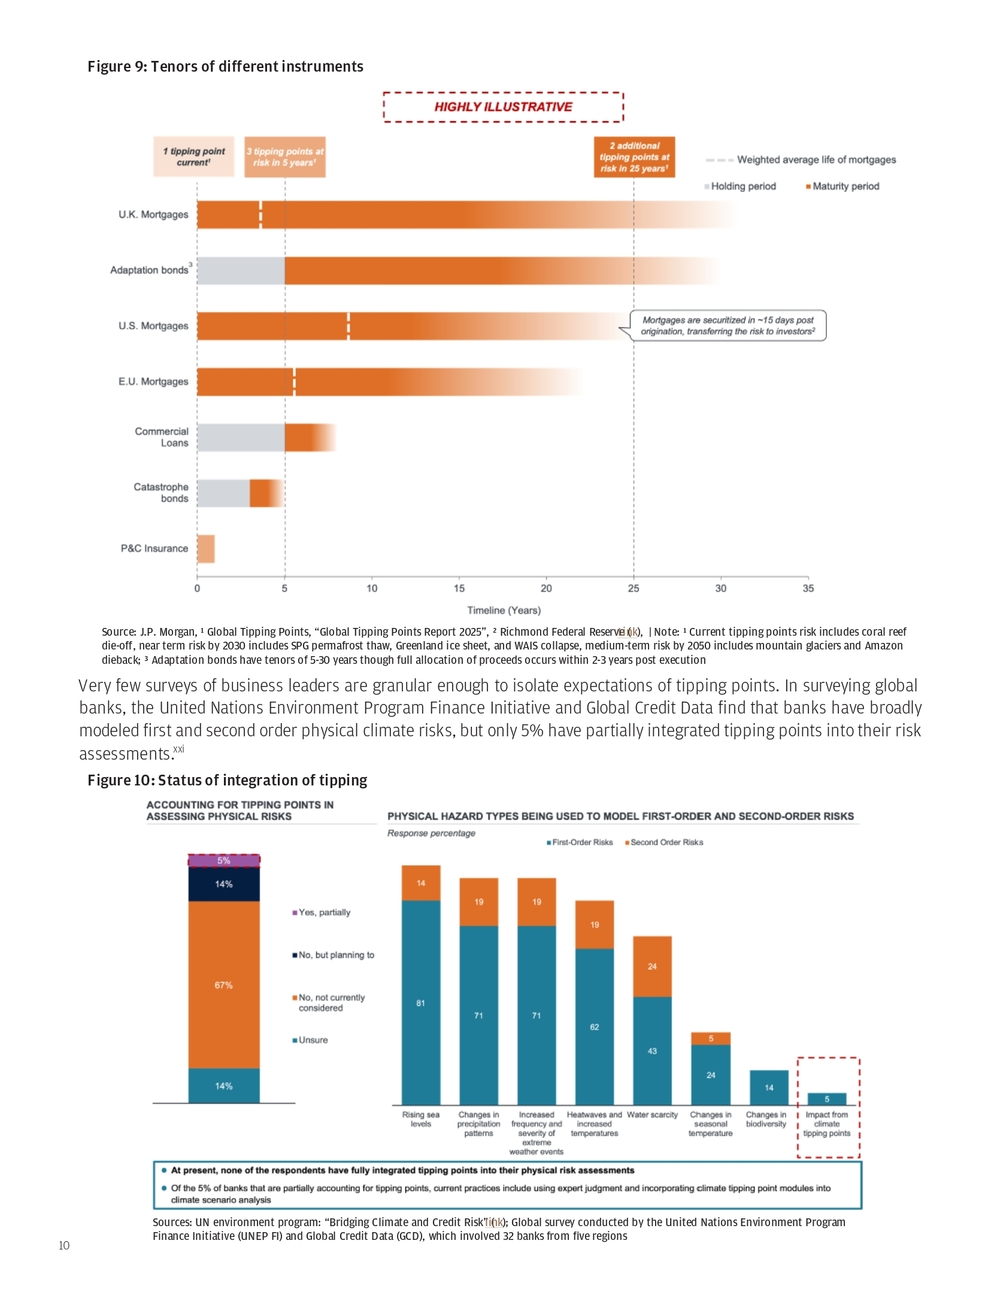
10 Very few surveys of business leaders are granular enough to isolate expectations of tipping points. In surveying global banks, the United Nations Environment Program Finance Initiative and Global Credit Data find that banks have broadly modeled first and second order physical climate risks, but only 5% have partially integrated tipping points into their risk assessments.xxi Figure 9: Tenors of different instruments Figure 10: Status of integration of tipping Source: J.P. Morgan, ¹ Global Tipping Points, “Global Tipping Points Report 2025”, ² Richmond Federal Reserve ( Link), | Note: ¹ Current tipping points risk includes coral reef die-off, near term risk by 2030 includes SPG permafrost thaw, Greenland ice sheet, and WAIS collapse, medium-term risk by 2050 includes mountain glaciers and Amazon dieback; ³ Adaptation bonds have tenors of 5-30 years though full allocation of proceeds occurs within 2-3 years post execution Sources: UN environment program: “Bridging Climate and Credit Risk” ( link); Global survey conducted by the United Nations Environment Program Finance Initiative (UNEP FI) and Global Credit Data (GCD), which involved 32 banks from five regions
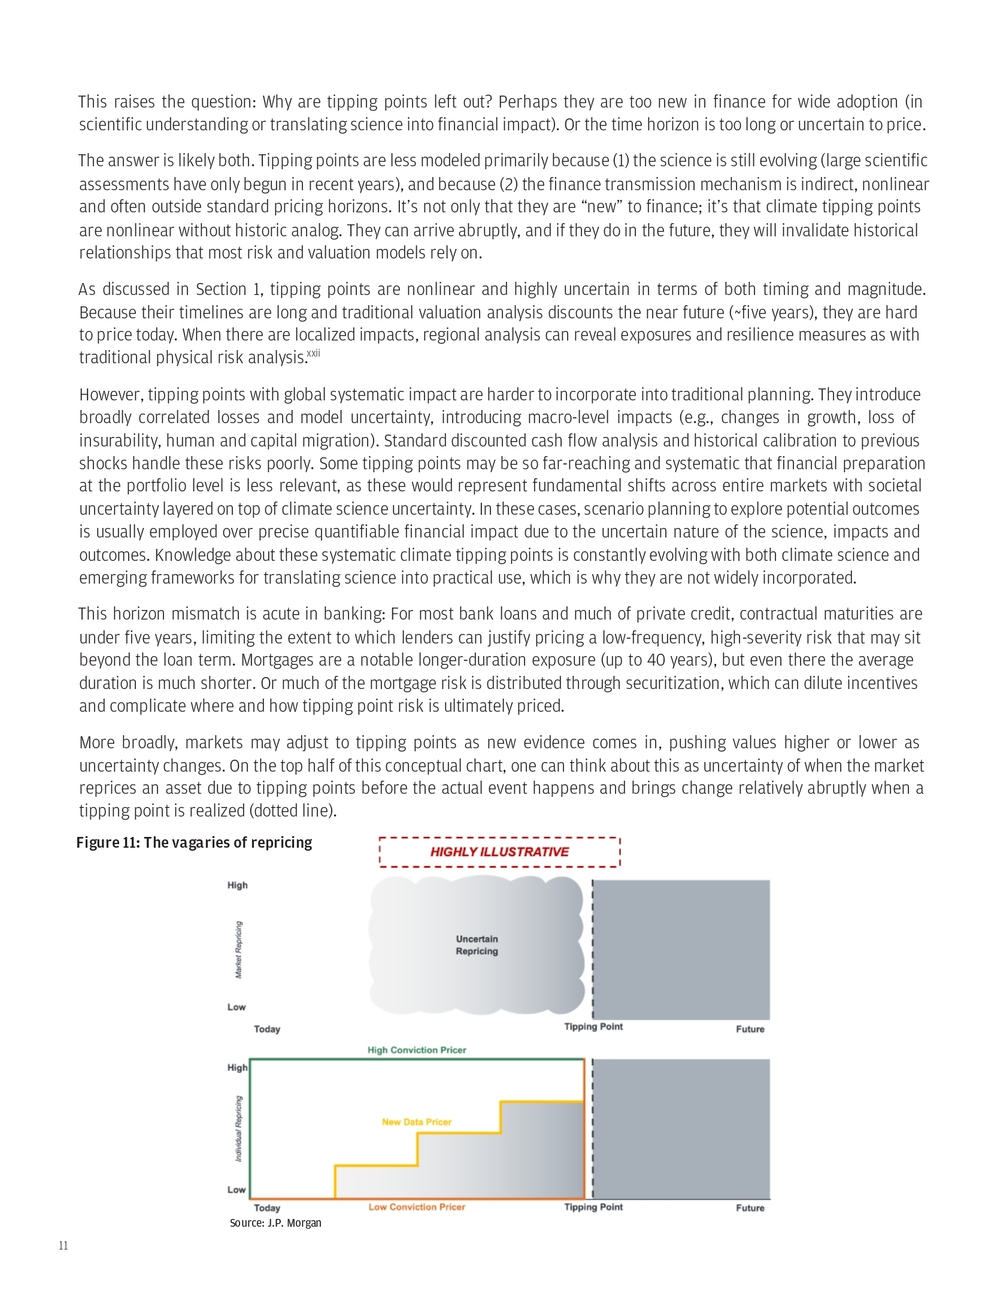
11This raises the question: Why are tipping points left out? Perhaps they are too new in finance for wide adoption (in scientific understanding or translating science into financial impact). Or the time horizon is too long or uncertain to price. The answer is likely both. Tipping points are less modeled primarily because (1) the science is still evolving (large scientific assessments have only begun in recent years), and because (2) the finance transmission mechanism is indirect, nonlinear and often outside standard pricing horizons. It’s not only that they are “new” to finance; it’s that climate tipping points are nonlinear without historic analog. They can arrive abruptly, and if they do in the future, they will invalidate historical relationships that most risk and valuation models rely on. As discussed in Section 1, tipping points are nonlinear and highly uncertain in terms of both timing and magnitude. Because their timelines are long and traditional valuation analysis discounts the near future (~five years), they are hard to price today. When there are localized impacts, regional analysis can reveal exposures and resilience measures as with traditional physical risk analysis.xxii However, tipping points with global systematic impact are harder to incorporate into traditional planning. They introduce broadly correlated losses and model uncertainty, introducing macro-level impacts (e.g., changes in growth, loss of insurability, human and capital migration). Standard discounted cash flow analysis and historical calibration to previous shocks handle these risks poorly. Some tipping points may be so far-reaching and systematic that financial preparation at the portfolio level is less relevant, as these would represent fundamental shifts across entire markets with societal uncertainty layered on top of climate science uncertainty. In these cases, scenario planning to explore potential outcomes is usually employed over precise quantifiable financial impact due to the uncertain nature of the science, impacts and outcomes. Knowledge about these systematic climate tipping points is constantly evolving with both climate science and emerging frameworks for translating science into practical use, which is why they are not widely incorporated. This horizon mismatch is acute in banking: For most bank loans and much of private credit, contractual maturities are under five years, limiting the extent to which lenders can justify pricing a low-frequency, high-severity risk that may sit beyond the loan term. Mortgages are a notable longer-duration exposure (up to 40 years), but even there the average duration is much shorter. Or much of the mortgage risk is distributed through securitization, which can dilute incentives and complicate where and how tipping point risk is ultimately priced. More broadly, markets may adjust to tipping points as new evidence comes in, pushing values higher or lower as uncertainty changes. On the top half of this conceptual chart, one can think about this as uncertainty of when the market reprices an asset due to tipping points before the actual event happens and brings change relatively abruptly when a tipping point is realized (dotted line). Figure 11: The vagaries of repricing Source: J.P. Morgan
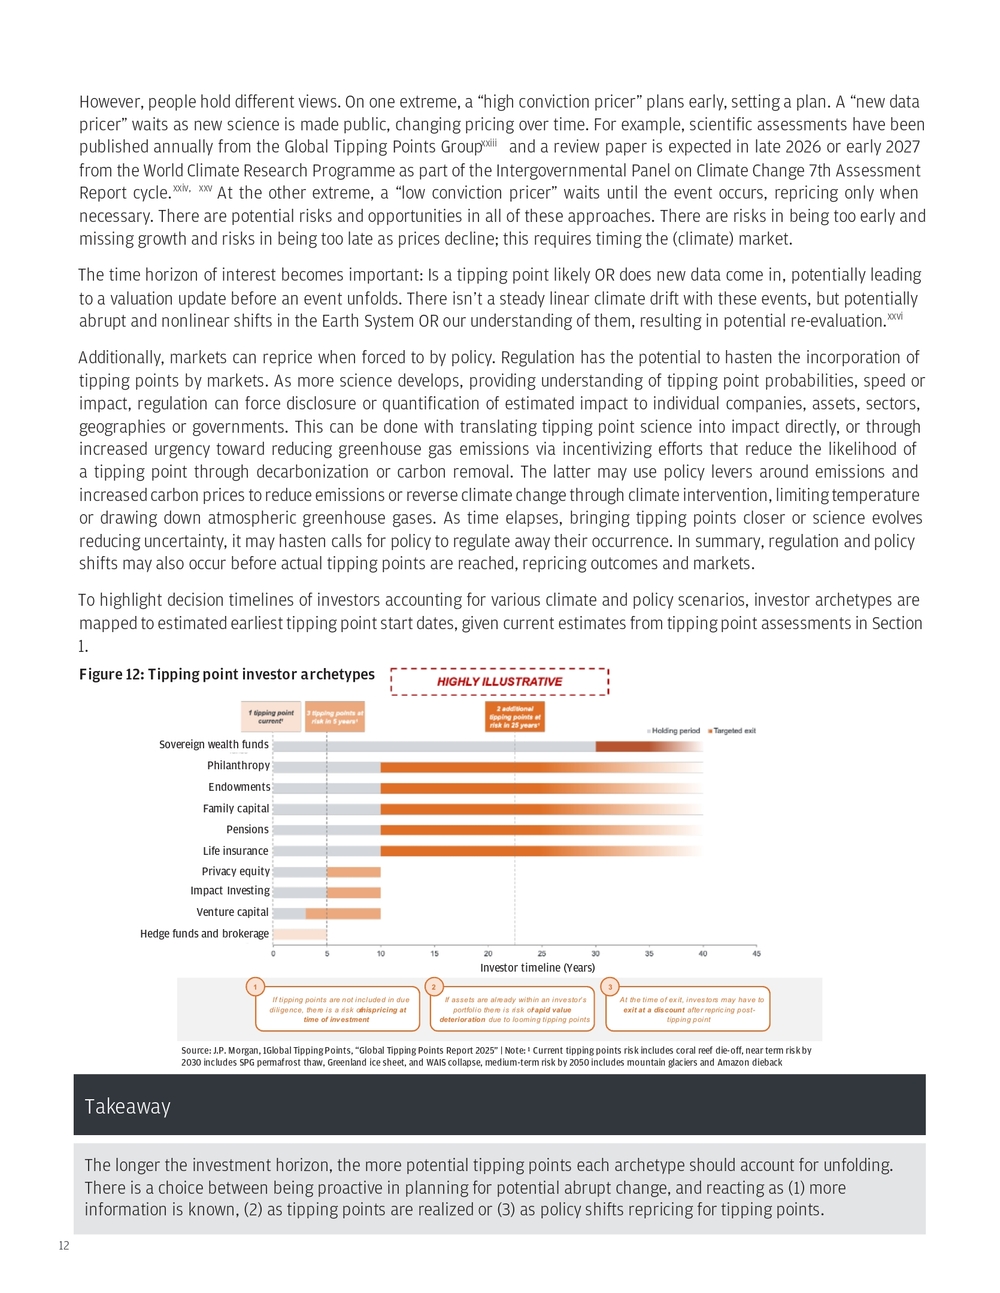
12However, people hold different views. On one extreme, a “high conviction pricer” plans early, setting a plan. A “new data pricer” waits as new science is made public, changing pricing over time. For example, scientific assessments have been published annually from the Global Tipping Points Groupxxiii and a review paper is expected in late 2026 or early 2027 from the World Climate Research Programme as part of the Intergovernmental Panel on Climate Change 7th Assessment Report cycle.xxiv, xxv At the other extreme, a “low conviction pricer” waits until the event occurs, repricing only when necessary. There are potential risks and opportunities in all of these approaches. There are risks in being too early and missing growth and risks in being too late as prices decline; this requires timing the (climate) market. The time horizon of interest becomes important: Is a tipping point likely OR does new data come in, potentially leading to a valuation update before an event unfolds. There isn’t a steady linear climate drift with these events, but potentially abrupt and nonlinear shifts in the Earth System OR our understanding of them, resulting in potential re-evaluation.xxvi Additionally, markets can reprice when forced to by policy. Regulation has the potential to hasten the incorporation of tipping points by markets. As more science develops, providing understanding of tipping point probabilities, speed or impact, regulation can force disclosure or quantification of estimated impact to individual companies, assets, sectors, geographies or governments. This can be done with translating tipping point science into impact directly, or through increased urgency toward reducing greenhouse gas emissions via incentivizing efforts that reduce the likelihood of a tipping point through decarbonization or carbon removal. The latter may use policy levers around emissions and increased carbon prices to reduce emissions or reverse climate change through climate intervention, limiting temperature or drawing down atmospheric greenhouse gases. As time elapses, bringing tipping points closer or science evolves reducing uncertainty, it may hasten calls for policy to regulate away their occurrence. In summary, regulation and policy shifts may also occur before actual tipping points are reached, repricing outcomes and markets. To highlight decision timelines of investors accounting for various climate and policy scenarios, investor archetypes are mapped to estimated earliest tipping point start dates, given current estimates from tipping point assessments in Section 1. The longer the investment horizon, the more potential tipping points each archetype should account for unfolding. There is a choice between being proactive in planning for potential abrupt change, and reacting as (1) more information is known, (2) as tipping points are realized or (3) as policy shifts repricing for tipping points.TakeawayFigure 12: Tipping point investor archetypes Source: J.P. Morgan, 1Global Tipping Points, “Global Tipping Points Report 2025” | Note: ¹ Current tipping points risk includes coral reef die-off, near term risk by 2030 includes SPG permafrost thaw, Greenland ice sheet, and WAIS collapse, medium-term risk by 2050 includes mountain glaciers and Amazon dieback If tipping points are not included in due diligence, there is a risk of mispricing at time of investment At the time of exit, investors may have to exit at a discount after repricing post- tipping pointIf assets are already within an investor’s portfolio there is risk of rapid value deterioration due to looming tipping points 1 2 3Sovereign wealth funds Philanthropy Endowments Family capital Pensions Life insurance Privacy equity Impact Investing Venture capital Hedge funds and brokerage Investor timeline (Years)
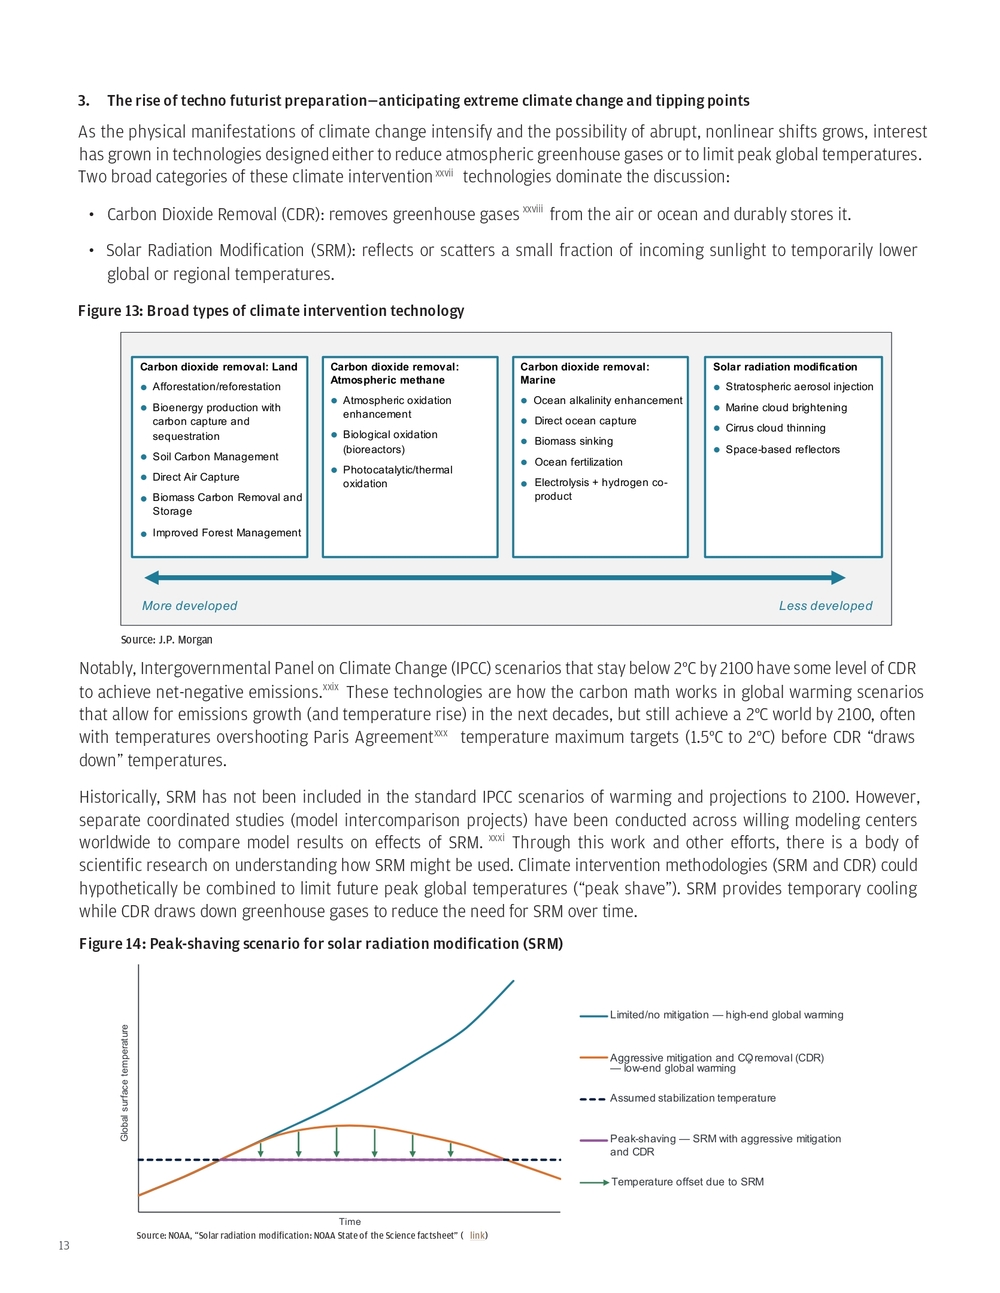
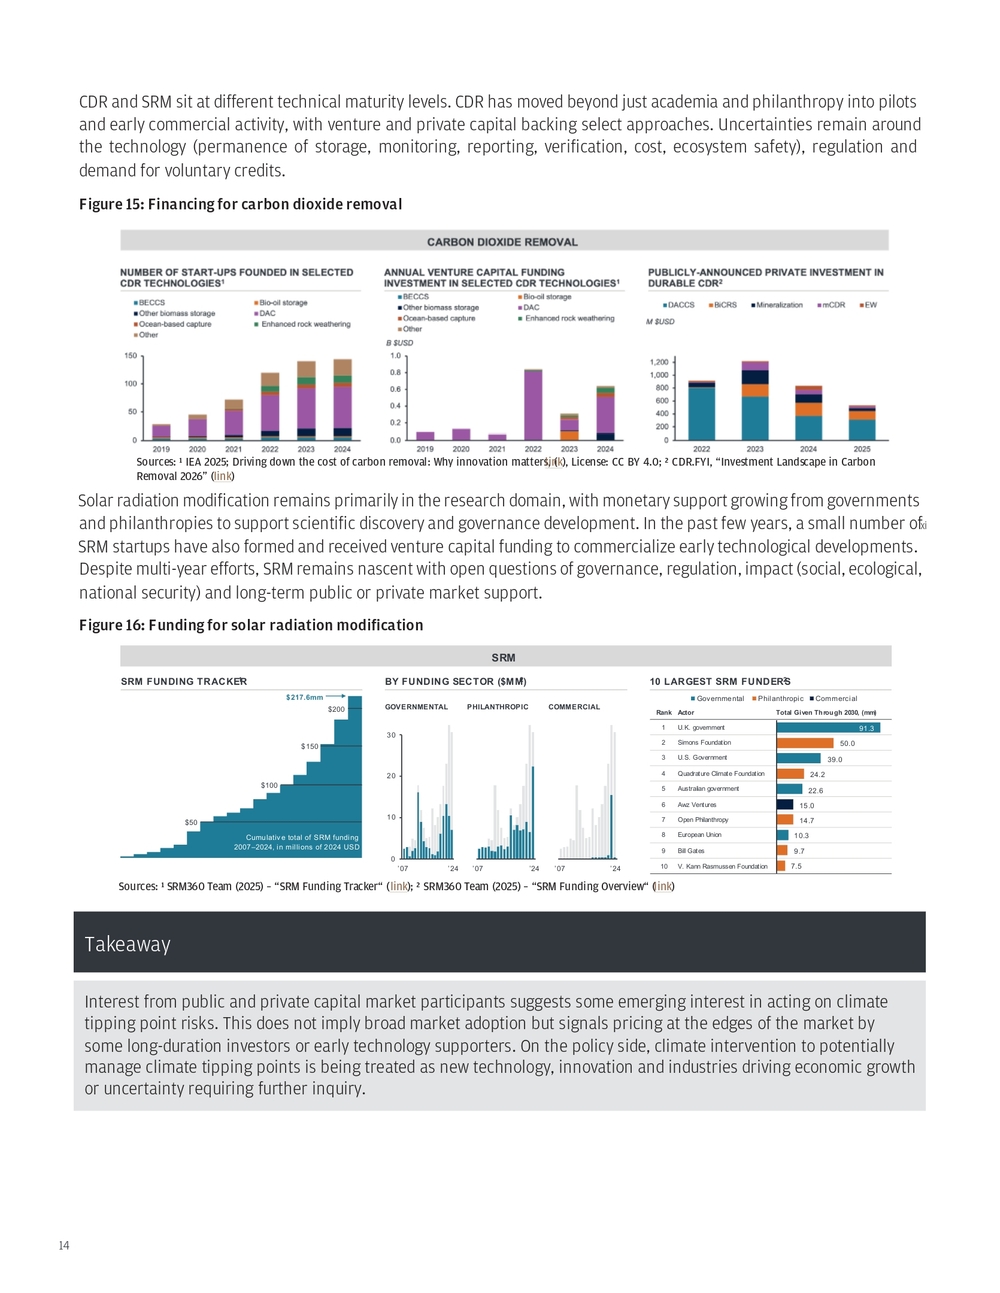
- The rise of techno futurist preparation—anticipating extreme climate change and tipping points As the physical manifestations of climate change intensify and the possibility of abrupt, nonlinear shifts grows, interest has grown in technologies designed either to reduce atmospheric greenhouse gases or to limit peak global temperatures. Two broad categories of these climate interventionxxvii technologies dominate the discussion: • Carbon Dioxide Removal (CDR): removes greenhouse gasesxxviii from the air or ocean and durably stores it. • Solar Radiation Modification (SRM): reflects or scatters a small fraction of incoming sunlight to temporarily lower global or regional temperatures. Notably, Intergovernmental Panel on Climate Change (IPCC) scenarios that stay below 2°C by 2100 have some level of CDR to achieve net -negative emissions.xxix These technologies are how the carbon math works in global warming scenarios that allow for emissions growth (and temperature rise) in the next decades, but still achieve a 2°C world by 2100, often with temperatures overshooting Paris Agreementxxx temperature maximum targets (1.5°C to 2°C) before CDR “draws down” temperatures. Historically, SRM has not been included in the standard IPCC scenarios of warming and projections to 2100. However, separate coordinated studies (model intercomparison projects) have been conducted across willing modeling centers worldwide to compare model results on effects of SRM.xxxi Through this work and other efforts, there is a body of scientific research on understanding how SRM might be used. Climate intervention methodologies (SRM and CDR) could hypothetically be combined to limit future peak global temperatures (“peak shave”). SRM provides temporary cooling while CDR draws down greenhouse gases to reduce the need for SRM over time.Figure 13: Broad types of climate intervention technology Figure 14: Peak-shaving scenario for solar radiation modification (SRM)Carbon dioxide removal: Land lAfforestation/reforestation lBioenergy production with carbon capture and sequestration lSoil Carbon Management lDirect Air Capture lBiomass Carbon Removal and Storage lImproved Forest ManagementCarbon dioxide removal: Marine lOcean alkalinity enhancement lDirect ocean capture lBiomass sinking lOcean fertilization lElectrolysis + hydrogen co- product Solar radiation modification lStratospheric aerosol injection lMarine cloud brightening lCirrus cloud thinning lSpace- based reflectorsCarbon dioxide removal: Atmospheric methane lAtmospheric oxidation enhancement lBiological oxidation (bioreactors) lPhotocatalytic/thermal oxidation More developed Less developed Source: J.P. Morgan Global surface temperature TimeLimited/no mitigation — high-end global warming Aggressive mitigation and CO₂ removal (CDR) —low-end global warming Assumed stabilization temperature Peak-shaving — SRM with aggressive mitigation and CDR Temperature offset due to SRM Source: NOAA, “Solar radiation modification: NOAA State of the Science factsheet” ( link)
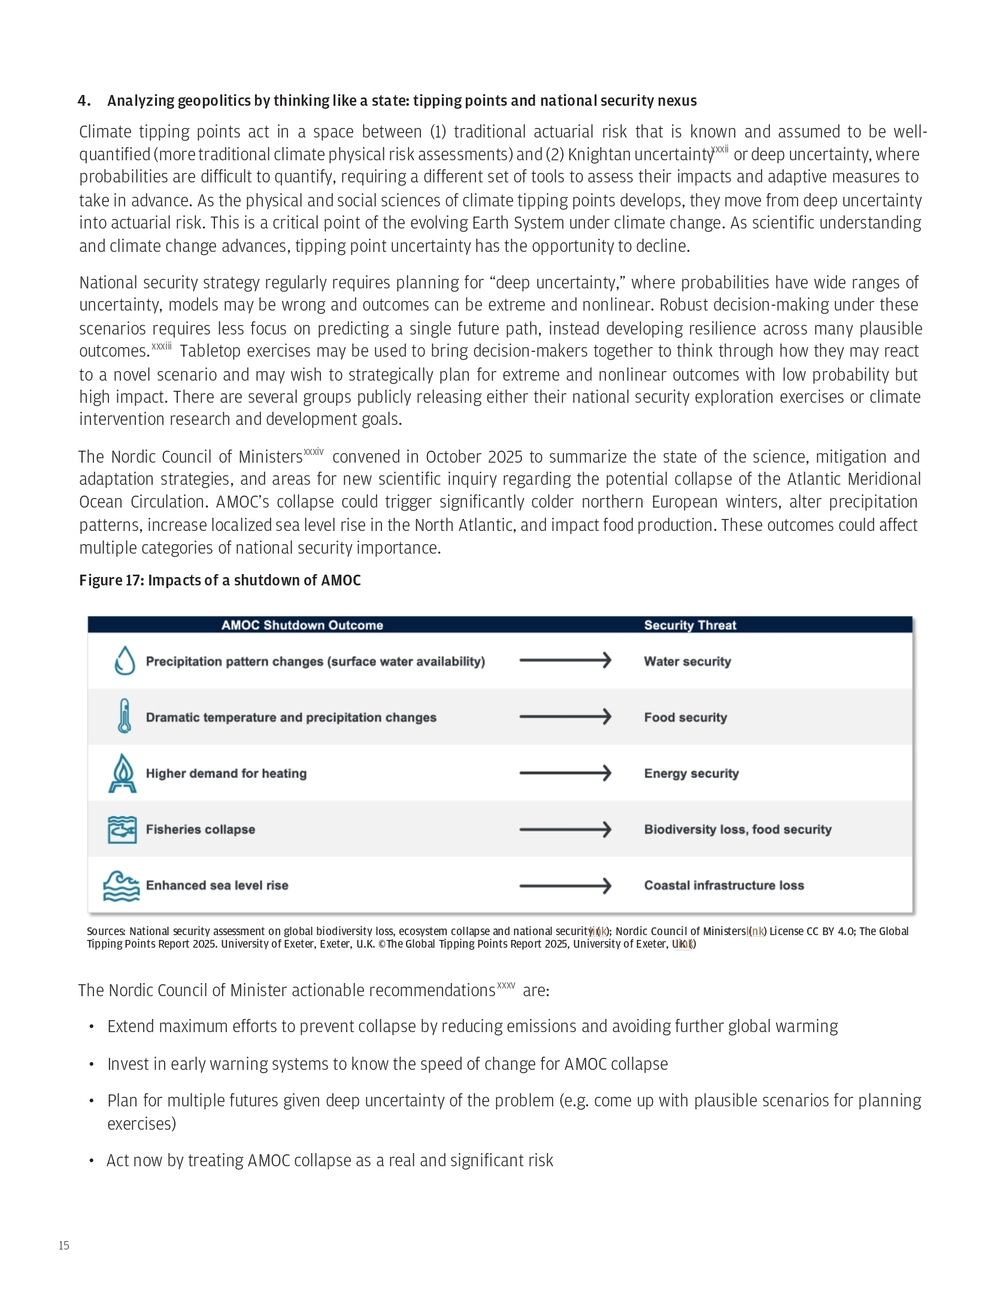
14CDR and SRM sit at different technical maturity levels. CDR has moved beyond just academia and philanthropy into pilots and early commercial activity, with venture and private capital backing select approaches. Uncertainties remain around the technology (permanence of storage, monitoring, reporting, verification, cost, ecosystem safety), regulation and demand for voluntary credits. Solar radiation modification remains primarily in the research domain, with monetary support growing from governments and philanthropies to support scientific discovery and governance development. In the past few years, a small number of SRM startups have also formed and received venture capital funding to commercialize early technological developments. Despite multi-year efforts, SRM remains nascent with open questions of governance, regulation, impact (social, ecological, national security) and long-term public or private market support. xi Interest from public and private capital market participants suggests some emerging interest in acting on climate tipping point risks. This does not imply broad market adoption but signals pricing at the edges of the market by some long-duration investors or early technology supporters. On the policy side, climate intervention to potentially manage climate tipping points is being treated as new technology, innovation and industries driving economic growth or uncertainty requiring further inquiry.Figure 15: Financing for carbon dioxide removal Figure 16: Funding for solar radiation modificationSources: ¹ IEA 2025; Driving down the cost of carbon removal: Why innovation matters, ( link), License: CC BY 4.0; ² CDR.FYI, “Investment Landscape in Carbon Removal 2026” ( link) Sources: ¹ SRM360 Team (2025) – “SRM Funding Tracker“ ( link); ² SRM360 Team (2025) – “SRM Funding Overview“ ( link)Total Given Through 2030, (mm) Actor Rank U.K. government 1 Simons Foundation 2 U.S. Government 3 Quadrature Climate Foundation 4 Australian government 5 Awz Ventures 6 Open Philanthropy 7 European Union 8 Bill Gates 9 V. Kann Rasmussen Foundation 1091.3 39.0 22.6 10.350.0 24.2 14.7 9.7 7.515.0Governmenta l Philan throp ic CommercialSRM 10 LARGEST SRM FUNDERS2 BY FUNDING SECTOR ($MM)2 0102030 ’07 ’24 ’07 ’24 ’07 ’24GOVERNMENTAL PHILANTHROPIC COMMERCIAL SRM FUNDING TRACKER1 $217.6mm $200 $150 $100 $50 Cumulative total of SRM funding 2007– 2024, in millions of 2024 USD Takeaway
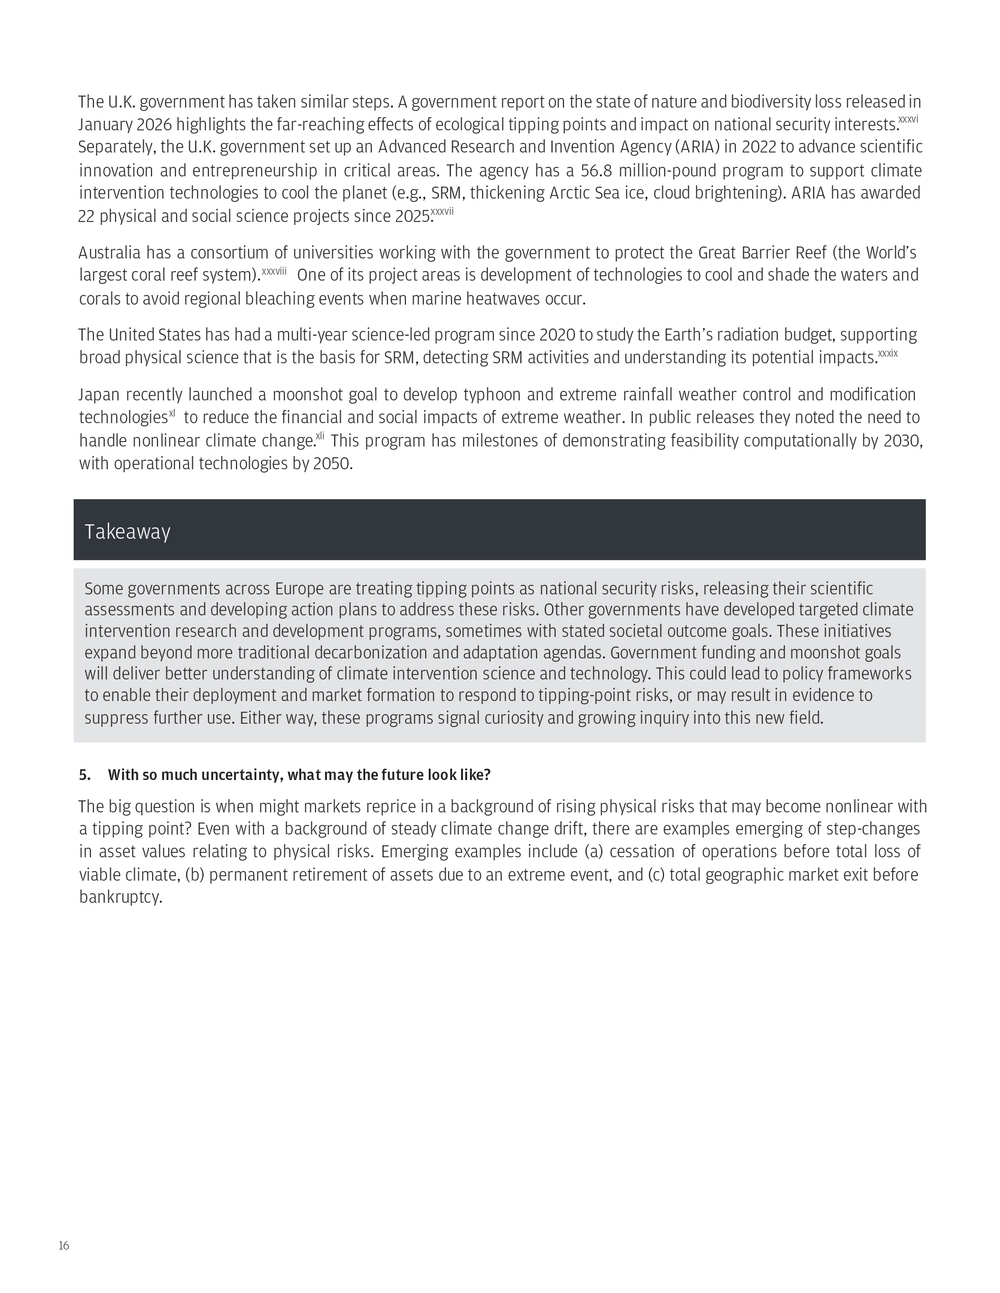
- Analyzing geopolitics by thinking like a state: tipping points and national security nexus Climate tipping points act in a space between (1) traditional actuarial risk that is known and assumed to be well- quantified (more traditional climate physical risk assessments) and (2) Knightan uncertaintyxxxii or deep uncertainty, where probabilities are difficult to quantify, requiring a different set of tools to assess their impacts and adaptive measures to take in advance. As the physical and social sciences of climate tipping points develops, they move from deep uncertainty into actuarial risk. This is a critical point of the evolving Earth System under climate change. As scientific understanding and climate change advances, tipping point uncertainty has the opportunity to decline. National security strategy regularly requires planning for “deep uncertainty,” where probabilities have wide ranges of uncertainty, models may be wrong and outcomes can be extreme and nonlinear. Robust decision-making under these scenarios requires less focus on predicting a single future path, instead developing resilience across many plausible outcomes.xxxiii Tabletop exercises may be used to bring decision-makers together to think through how they may react to a novel scenario and may wish to strategically plan for extreme and nonlinear outcomes with low probability but high impact. There are several groups publicly releasing either their national security exploration exercises or climate intervention research and development goals. The Nordic Council of Ministersxxxiv convened in October 2025 to summarize the state of the science, mitigation and adaptation strategies, and areas for new scientific inquiry regarding the potential collapse of the Atlantic Meridional Ocean Circulation. AMOC’s collapse could trigger significantly colder northern European winters, alter precipitation patterns, increase localized sea level rise in the North Atlantic, and impact food production. These outcomes could affect multiple categories of national security importance. The Nordic Council of Minister actionable recommendationsxxxv are: • Extend maximum efforts to prevent collapse by reducing emissions and avoiding further global warming • Invest in early warning systems to know the speed of change for AMOC collapse • Plan for multiple futures given deep uncertainty of the problem (e.g. come up with plausible scenarios for planning exercises) • Act now by treating AMOC collapse as a real and significant risk Figure 17: Impacts of a shutdown of AMOC Sources: National security assessment on global biodiversity loss, ecosystem collapse and national security ( link); Nordic Council of Ministers ( link) License CC BY 4.0; The Global Tipping Points Report 2025. University of Exeter, Exeter, U.K. ©The Global Tipping Points Report 2025, University of Exeter, UK ( link)
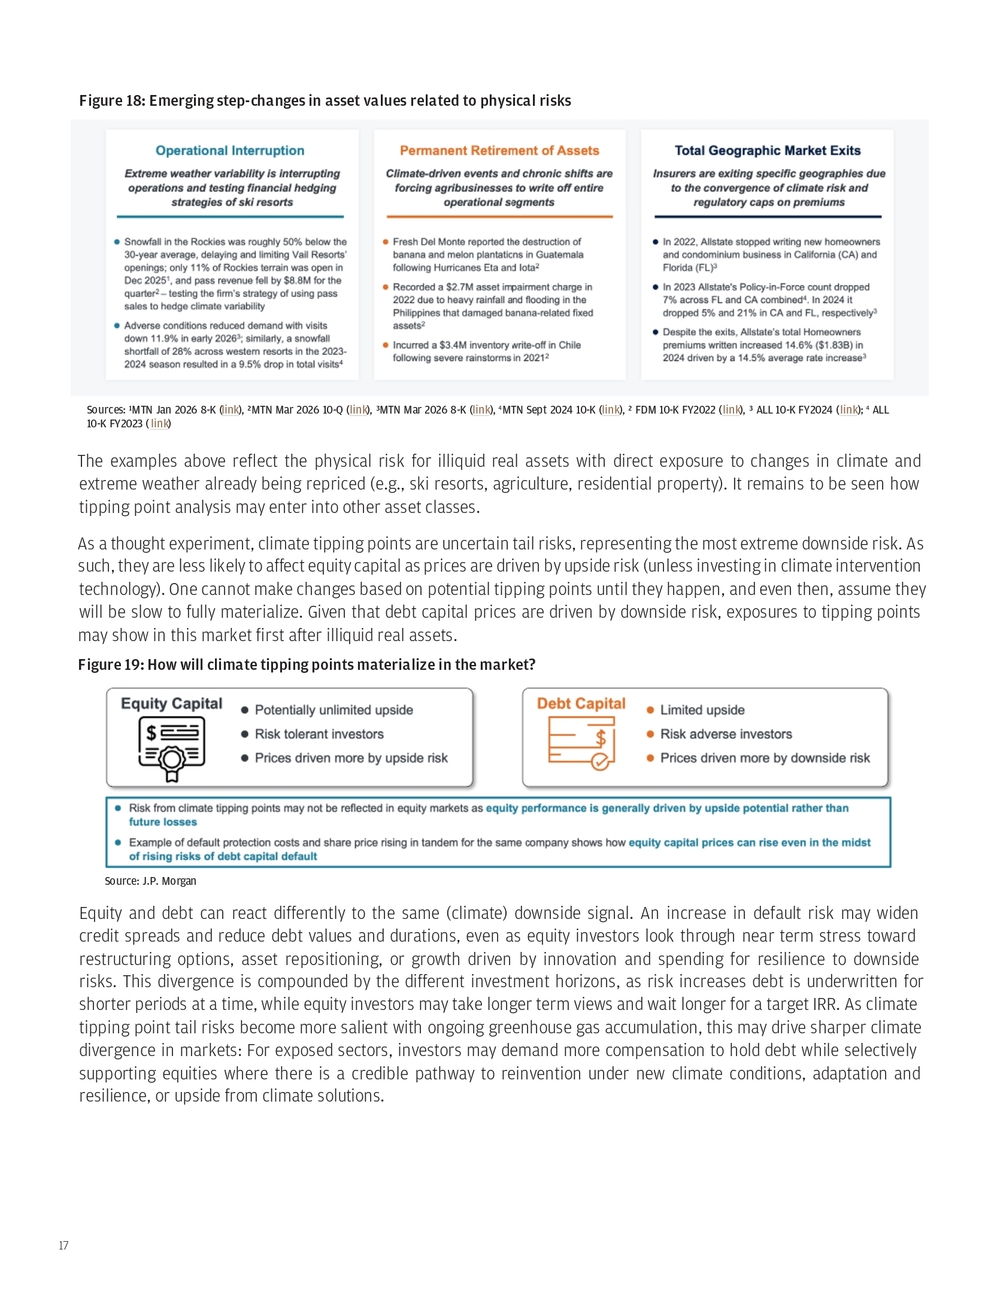
16TakeawayThe U.K. government has taken similar steps. A government report on the state of nature and biodiversity loss released in January 2026 highlights the far-reaching effects of ecological tipping points and impact on national security interests.xxxvi Separately, the U.K. government set up an Advanced Research and Invention Agency (ARIA) in 2022 to advance scientific innovation and entrepreneurship in critical areas. The agency has a 56.8 million-pound program to support climate intervention technologies to cool the planet (e.g., SRM, thickening Arctic Sea ice, cloud brightening). ARIA has awarded 22 physical and social science projects since 2025.xxxvii Australia has a consortium of universities working with the government to protect the Great Barrier Reef (the World’s largest coral reef system).xxxviii One of its project areas is development of technologies to cool and shade the waters and corals to avoid regional bleaching events when marine heatwaves occur. The United States has had a multi-year science-led program since 2020 to study the Earth’s radiation budget, supporting broad physical science that is the basis for SRM, detecting SRM activities and understanding its potential impacts.xxxix Japan recently launched a moonshot goal to develop typhoon and extreme rainfall weather control and modification technologiesxl to reduce the financial and social impacts of extreme weather. In public releases they noted the need to handle nonlinear climate change.xli This program has milestones of demonstrating feasibility computationally by 2030, with operational technologies by 2050. Some governments across Europe are treating tipping points as national security risks, releasing their scientific assessments and developing action plans to address these risks. Other governments have developed targeted climate intervention research and development programs, sometimes with stated societal outcome goals. These initiatives expand beyond more traditional decarbonization and adaptation agendas. Government funding and moonshot goals will deliver better understanding of climate intervention science and technology. This could lead to policy frameworks to enable their deployment and market formation to respond to tipping-point risks, or may result in evidence to suppress further use. Either way, these programs signal curiosity and growing inquiry into this new field. 5. With so much uncertainty, what may the future look like? The big question is when might markets reprice in a background of rising physical risks that may become nonlinear with a tipping point? Even with a background of steady climate change drift, there are examples emerging of step-changes in asset values relating to physical risks. Emerging examples include (a) cessation of operations before total loss of viable climate, (b) permanent retirement of assets due to an extreme event, and (c) total geographic market exit before bankruptcy.
17The examples above reflect the physical risk for illiquid real assets with direct exposure to changes in climate and extreme weather already being repriced (e.g., ski resorts, agriculture, residential property). It remains to be seen how tipping point analysis may enter into other asset classes. As a thought experiment, climate tipping points are uncertain tail risks, representing the most extreme downside risk. As such, they are less likely to affect equity capital as prices are driven by upside risk (unless investing in climate intervention technology). One cannot make changes based on potential tipping points until they happen, and even then, assume they will be slow to fully materialize. Given that debt capital prices are driven by downside risk, exposures to tipping points may show in this market first after illiquid real assets. Equity and debt can react differently to the same (climate) downside signal. An increase in default risk may widen credit spreads and reduce debt values and durations, even as equity investors look through near term stress toward restructuring options, asset repositioning, or growth driven by innovation and spending for resilience to downside risks. This divergence is compounded by the different investment horizons, as risk increases debt is underwritten for shorter periods at a time, while equity investors may take longer term views and wait longer for a target IRR. As climate tipping point tail risks become more salient with ongoing greenhouse gas accumulation, this may drive sharper climate divergence in markets: For exposed sectors, investors may demand more compensation to hold debt while selectively supporting equities where there is a credible pathway to reinvention under new climate conditions, adaptation and resilience, or upside from climate solutions. Figure 18: Emerging step-changes in asset values related to physical risks Figure 19: How will climate tipping points materialize in the market?Sources: ¹MTN Jan 2026 8-K ( link), ²MTN Mar 2026 10-Q ( link), ³MTN Mar 2026 8-K ( link), 4MTN Sept 2024 10-K ( link), ² FDM 10-K FY2022 ( link), ³ ALL 10-K FY2024 ( link); 4 ALL 10-K FY2023 ( link) Source: J.P. Morgan
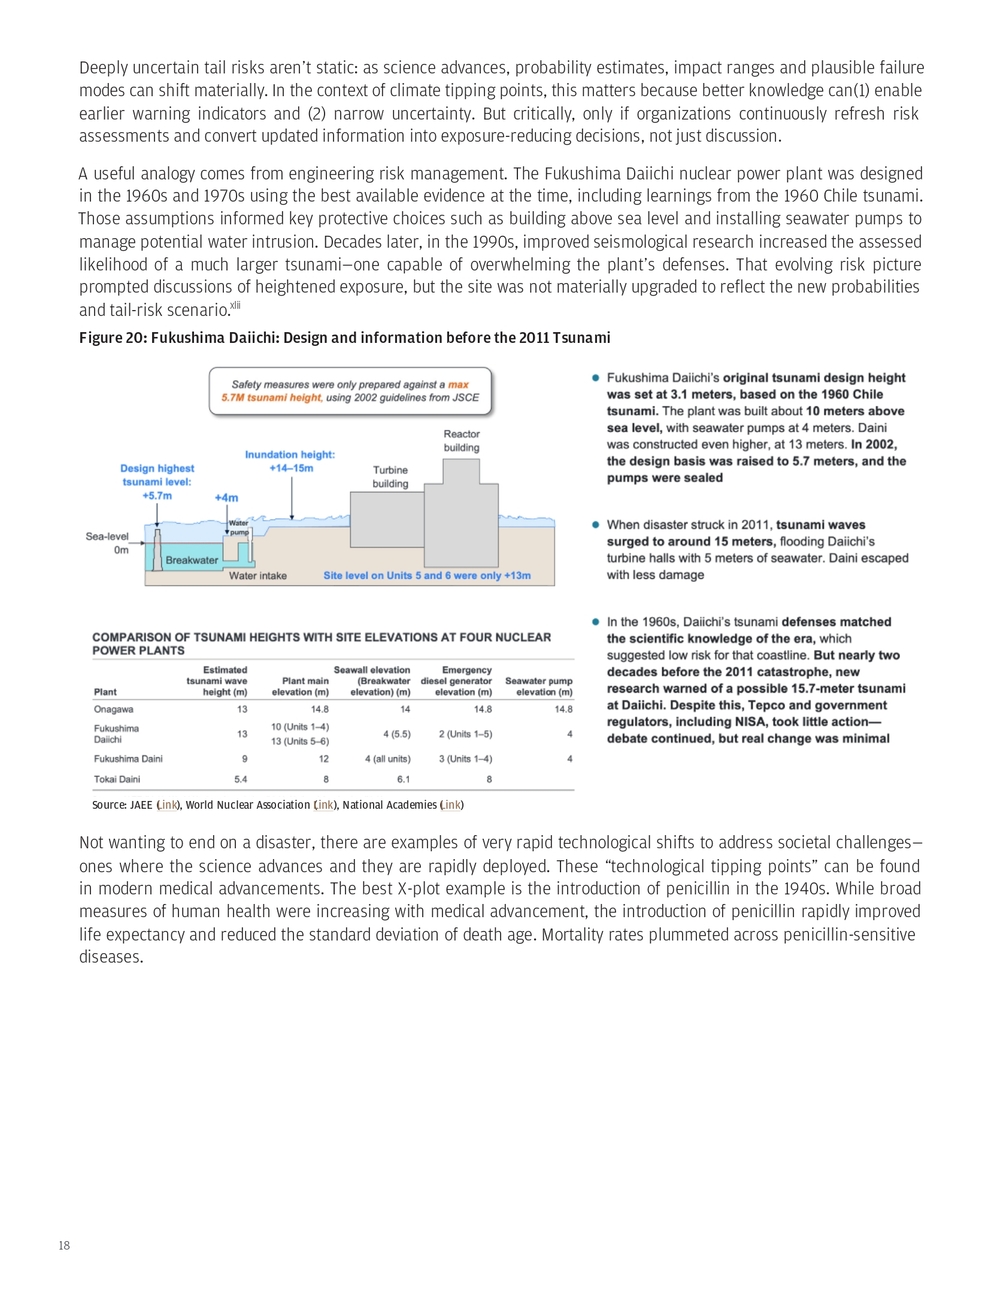
18Deeply uncertain tail risks aren’t static: as science advances, probability estimates, impact ranges and plausible failure modes can shift materially. In the context of climate tipping points, this matters because better knowledge can(1) enable earlier warning indicators and (2) narrow uncertainty. But critically, only if organizations continuously refresh risk assessments and convert updated information into exposure-reducing decisions, not just discussion. A useful analogy comes from engineering risk management. The Fukushima Daiichi nuclear power plant was designed in the 1960s and 1970s using the best available evidence at the time, including learnings from the 1960 Chile tsunami. Those assumptions informed key protective choices such as building above sea level and installing seawater pumps to manage potential water intrusion. Decades later, in the 1990s, improved seismological research increased the assessed likelihood of a much larger tsunami—one capable of overwhelming the plant’s defenses. That evolving risk picture prompted discussions of heightened exposure, but the site was not materially upgraded to reflect the new probabilities and tail-risk scenario.xlii Figure 20: Fukushima Daiichi: Design and information before the 2011 Tsunami Source: JAEE ( Link), World Nuclear Association ( Link), National Academies ( Link) Not wanting to end on a disaster, there are examples of very rapid technological shifts to address societal challenges— ones where the science advances and they are rapidly deployed. These “technological tipping points” can be found in modern medical advancements. The best X-plot example is the introduction of penicillin in the 1940s. While broad measures of human health were increasing with medical advancement, the introduction of penicillin rapidly improved life expectancy and reduced the standard deviation of death age. Mortality rates plummeted across penicillin-sensitive diseases.
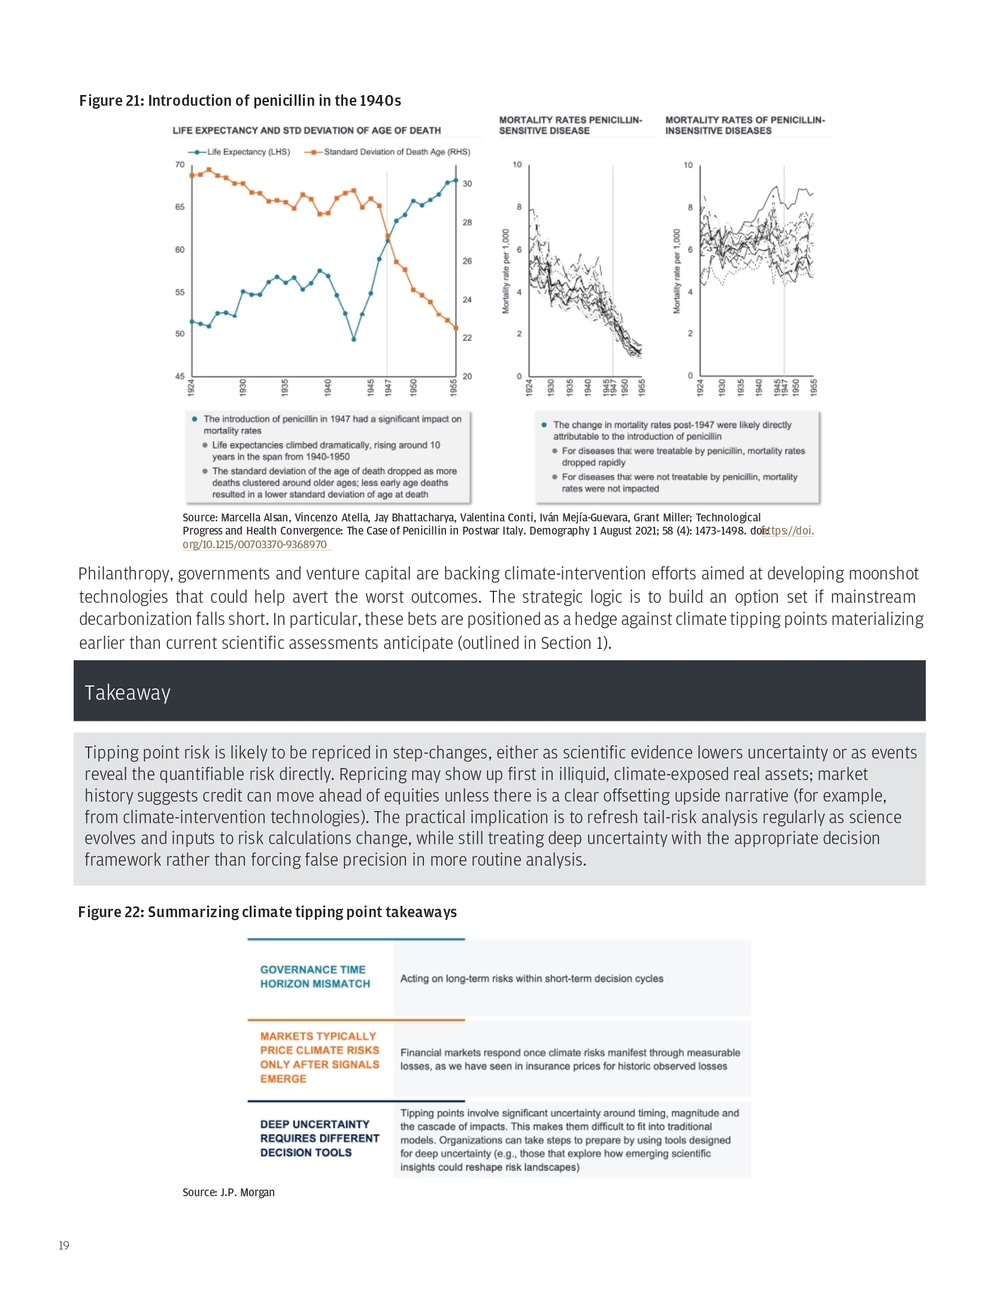
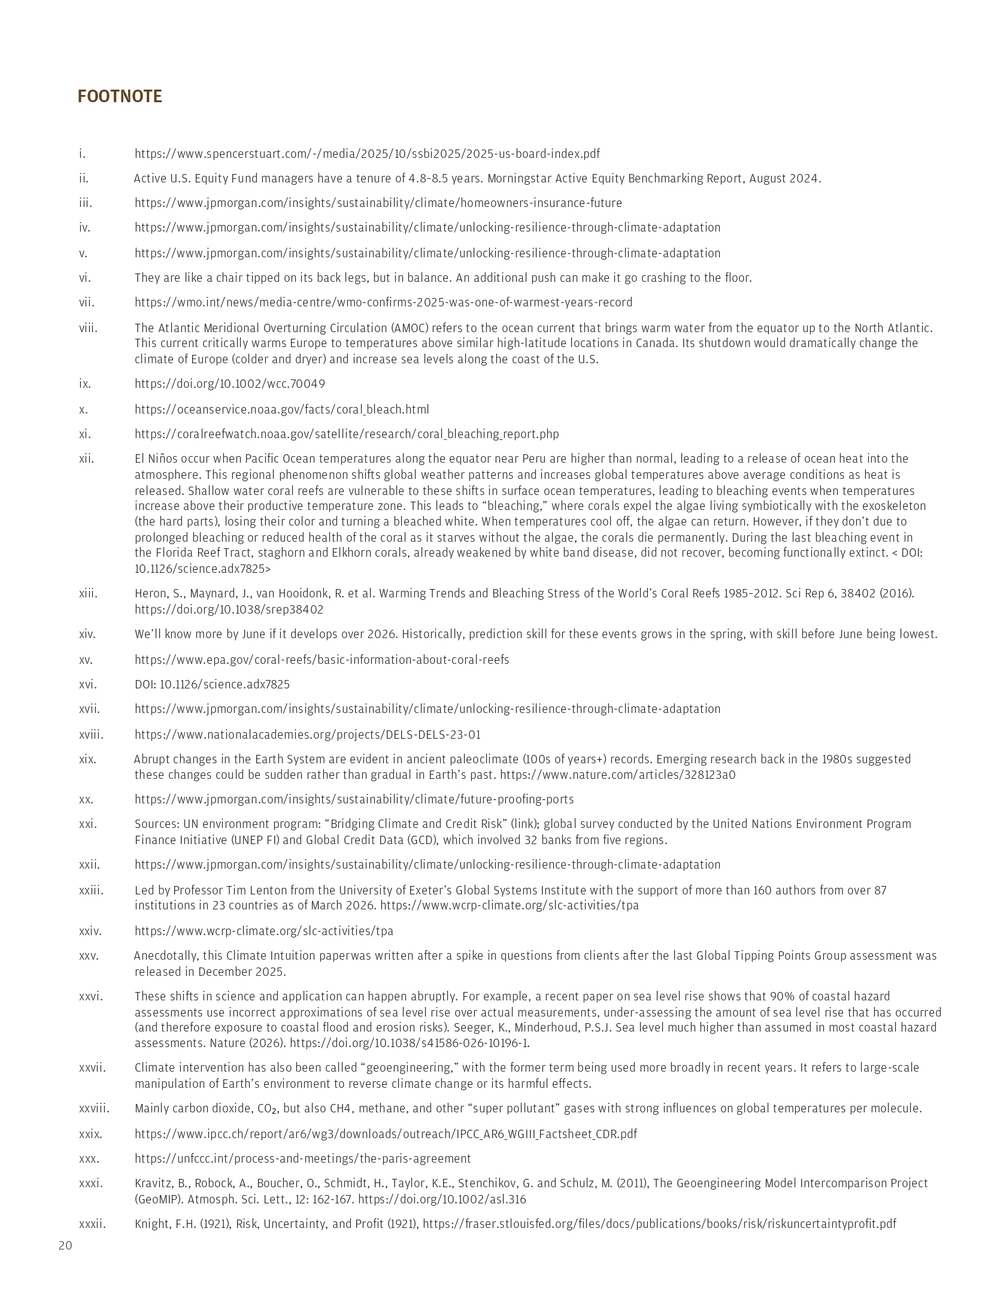
19Takeaway Philanthropy, governments and venture capital are backing climate-intervention efforts aimed at developing moonshot technologies that could help avert the worst outcomes. The strategic logic is to build an option set if mainstream decarbonization falls short. In particular, these bets are positioned as a hedge against climate tipping points materializing earlier than current scientific assessments anticipate (outlined in Section 1). Tipping point risk is likely to be repriced in step-changes, either as scientific evidence lowers uncertainty or as events reveal the quantifiable risk directly. Repricing may show up first in illiquid, climate-exposed real assets; market history suggests credit can move ahead of equities unless there is a clear offsetting upside narrative (for example, from climate-intervention technologies). The practical implication is to refresh tail-risk analysis regularly as science evolves and inputs to risk calculations change, while still treating deep uncertainty with the appropriate decision framework rather than forcing false precision in more routine analysis. Figure 22: Summarizing climate tipping point takeawaysFigure 21: Introduction of penicillin in the 1940s Source: Marcella Alsan, Vincenzo Atella, Jay Bhattacharya, Valentina Conti, Iván Mejía-Guevara, Grant Miller; Technological Progress and Health Convergence: The Case of Penicillin in Postwar Italy. Demography 1 August 2021; 58 (4): 1473–1498. doi: https://doi. org/10.1215/00703370-9368970 Source: J.P. Morgan
20FOOTNOTE i. https://www.spencerstuart.com/-/media/2025/10/ssbi2025/2025-us-board-index.pdf ii. Active U.S. Equity Fund managers have a tenure of 4.8–8.5 years. Morningstar Active Equity Benchmarking Report, August 2024. iii. https://www.jpmorgan.com/insights/sustainability/climate/homeowners-insurance-future iv. https://www.jpmorgan.com/insights/sustainability/climate/unlocking-resilience-through-climate-adaptation v. https://www.jpmorgan.com/insights/sustainability/climate/unlocking-resilience-through-climate-adaptation vi. They are like a chair tipped on its back legs, but in balance. An additional push can make it go crashing to the floor. vii. https://wmo.int/news/media-centre/wmo-confirms-2025-was-one-of-warmest-years-record viii. The Atlantic Meridional Overturning Circulation (AMOC) refers to the ocean current that brings warm water from the equator up to the North Atlantic. This current critically warms Europe to temperatures above similar high-latitude locations in Canada. Its shutdown would dramatically change the climate of Europe (colder and dryer) and increase sea levels along the coast of the U.S. ix. https://doi.org/10.1002/wcc.70049 x. https://oceanservice.noaa.gov/facts/coral_bleach.html xi. https://coralreefwatch.noaa.gov/satellite/research/coral_bleaching_report.php xii. El Niños occur when Pacific Ocean temperatures along the equator near Peru are higher than normal, leading to a release of ocean heat into the atmosphere. This regional phenomenon shifts global weather patterns and increases global temperatures above average conditions as heat is released. Shallow water coral reefs are vulnerable to these shifts in surface ocean temperatures, leading to bleaching events when temperatures increase above their productive temperature zone. This leads to “bleaching,” where corals expel the algae living symbiotically with the exoskeleton (the hard parts), losing their color and turning a bleached white. When temperatures cool off, the algae can return. However, if they don’t due to prolonged bleaching or reduced health of the coral as it starves without the algae, the corals die permanently. During the last bleaching event in the Florida Reef Tract, staghorn and Elkhorn corals, already weakened by white band disease, did not recover, becoming functionally extinct. < DOI: 10.1126/science.adx7825> xiii. Heron, S., Maynard, J., van Hooidonk, R. et al. Warming Trends and Bleaching Stress of the World’s Coral Reefs 1985–2012. Sci Rep 6, 38402 (2016). https://doi.org/10.1038/srep38402 xiv. We’ll know more by June if it develops over 2026. Historically, prediction skill for these events grows in the spring, with skill before June being lowest. xv. https://www.epa.gov/coral-reefs/basic-information-about-coral-reefs xvi. DOI: 10.1126/science.adx7825 xvii. https://www.jpmorgan.com/insights/sustainability/climate/unlocking-resilience-through-climate-adaptation xviii. https://www.nationalacademies.org/projects/DELS-DELS-23-01 xix. Abrupt changes in the Earth System are evident in ancient paleoclimate (100s of years+) records. Emerging research back in the 1980s suggested these changes could be sudden rather than gradual in Earth’s past. https://www.nature.com/articles/328123a0 xx. https://www.jpmorgan.com/insights/sustainability/climate/future-proofing-ports xxi. Sources: UN environment program: “Bridging Climate and Credit Risk” (link); global survey conducted by the United Nations Environment Program Finance Initiative (UNEP FI) and Global Credit Data (GCD), which involved 32 banks from five regions. xxii. https://www.jpmorgan.com/insights/sustainability/climate/unlocking-resilience-through-climate-adaptation xxiii. Led by Professor Tim Lenton from the University of Exeter’s Global Systems Institute with the support of more than 160 authors from over 87 institutions in 23 countries as of March 2026. https://www.wcrp-climate.org/slc-activities/tpa xxiv. https://www.wcrp-climate.org/slc-activities/tpa xxv. Anecdotally, this Climate Intuition paper was written after a spike in questions from clients after the last Global Tipping Points Group assessment was released in December 2025. xxvi. These shifts in science and application can happen abruptly. For example, a recent paper on sea level rise shows that 90% of coastal hazard assessments use incorrect approximations of sea level rise over actual measurements, under-assessing the amount of sea level rise that has occurred (and therefore exposure to coastal flood and erosion risks). Seeger, K., Minderhoud, P.S.J. Sea level much higher than assumed in most coastal hazard assessments. Nature (2026). https://doi.org/10.1038/s41586-026-10196-1. xxvii. Climate intervention has also been called “geoengineering,” with the former term being used more broadly in recent years. It refers to large-scale manipulation of Earth’s environment to reverse climate change or its harmful effects. xxviii. Mainly carbon dioxide, CO₂, but also CH4, methane, and other “super pollutant” gases with strong influences on global temperatures per molecule. xxix. https://www.ipcc.ch/report/ar6/wg3/downloads/outreach/IPCC_AR6_WGIII_Factsheet_CDR.pdf xxx. https://unfccc.int/process-and-meetings/the-paris-agreement xxxi. Kravitz, B., Robock, A., Boucher, O., Schmidt, H., Taylor, K.E., Stenchikov, G. and Schulz, M. (2011), The Geoengineering Model Intercomparison Project (GeoMIP). Atmosph. Sci. Lett., 12: 162-167. https://doi.org/10.1002/asl.316 xxxii. Knight, F.H. (1921), Risk, Uncertainty, and Profit (1921), https://fraser.stlouisfed.org/files/docs/publications/books/risk/riskuncertaintyprofit.pdf
21xxxiii. https://link.springer.com/book/10.1007/978-3-030-05252-2 xxxiv. Nordic Council of Minister member countries: Denmark, Finland, Iceland, Norway, Sweden and the Åland Islands, the Faroe Islands. Estonia, Germany, Netherlands, Switzerland, U.S., India, and U.K. also contributed to the report. xxxv. https://www.norden.org/en/publication/nordic-perspective-amoc-tipping xxxvi. https://www.gov.uk/government/publications/nature-security-assessment-on-global-biodiversity-loss-ecosystem-collapse-and-national-security xxxvii. https://aria.org.uk/opportunity-spaces/future-proofing-our-climate-and-weather/exploring-climate-cooling/funded-projects/ xxxviii. https://gbrrestoration.org/rrap-about-us/the-program-new/ xxxix. https://cpo.noaa.gov/divisions-programs/earth-system-science-and-modeling-division/earths-radiation-budget/ xl. While this paper is mainly focused on SRM, we have added weather modification goals of Japan in this section due to their focus on nonlinear climate change. There are several weather modification programs globally, mainly for enhanced precipitation for ski resorts or water supply. The Japanese moonshot is unique, in it is focused on typhoons (known as hurricanes in North America), requiring a larger intervention than rainfall or snowfall enhancement given the size of storms and remote locations (over the ocean). xli. https://www8.cao.go.jp/cstp/english/moonshot/sub8_en.html xlii. https://world-nuclear.org/information-library/safety-and-security/safety-of-plants/fukushima-daiichi-accident
22DISCLAIMER This material (including any commentary, data, trends, observations or the like) has been prepared by certain personnel of JPMorgan Chase & Co. It has not been reviewed, endorsed or otherwise approved by, and is not a work product of, any research department of JPMorgan Chase & Co. and/or its affiliates (collectively, “JPMorgan Chase”, “The firm”, “we”, “our”, or “us”). Any views or opinions expressed herein are solely those of the individual author and may differ from the views and opinions expressed by other departments or divisions of JPMorgan Chase. The information provided in this document reflects its author’s understanding and approach to climate change as at the date of this document and is subject to change without notice. We do not undertake to update any of such information in this document. Any and all transactions (including potential transactions) presented herein are for illustration purposes only. Neither JPMorgan Chase nor any of its directors, officers, employees, or agents shall incur any responsibility or liability whatsoever to any person or entity with respect to the contents of any matters referred herein, or discussed as a result of, this material. This material is for general information only and is not intended to be comprehensive and does not constitute investment, legal, or tax advice and it is not intended as an offer or solicitation for the purchase or sale of any financial instrument or as an official confirmation of any transaction or a recommendation for any investment product or strategy. The opinions and estimates herein constitute the author’s judgment and should be regarded as indicative, preliminary and for illustrative purposes only. No reports, documents or websites that are cited or referred to in this document shall be deemed to form part of this document. Information contained in this document has been obtained from sources, including those publicly available, believed to be reliable, but no representation or warranty is made by the document’s authors or JPMorgan Chase as to the quality, completeness, accuracy, fitness for a particular purpose or non-infringement of such information. Sources of third-party information referred to herein retain all rights with respect to such data and use of such data by JPMorgan Chase herein shall not be deemed to grant a license to any third party. In no event shall JPMorgan Chase be liable (whether in contract, tort, equity or otherwise) for any use by any party of, for any decision made or action taken by any party in reliance upon, or for any inaccuracies or errors in, or omissions from, the information contained herein and such information may not be relied upon by you in evaluating the merits of participating in any transaction. Numbers in various tables may not sum due to rounding. This material does not and should not be deemed to constitute an advertisement or marketing of the Firm’s products and/or services or an advertisement to the public. The use of any third-party trademarks or brand names is for informational purposes only and does not imply an endorsement by JPMorgan Chase or that such trademark owner has authorized JPMorgan Chase to promote its products or services. RESTRICTED DISTRIBUTION: This material is distributed by the relevant JPMorgan Chase entities that possess the necessary licenses to distribute the material in the respective countries. This material and statements made herein are proprietary and confidential to JPMorgan Chase and are for your personal use only and are not intended to be legally binding. Any distribution, copy, reprints and/or forward to others is strictly prohibited. https://www.jpmorgan.com/disclosures ©2026 JPMorgan Chase & Co. All rights reserved.
23