JPM MA Themes_10.2026
by JPMorgan
Forces Shaping M&A Market Outlook

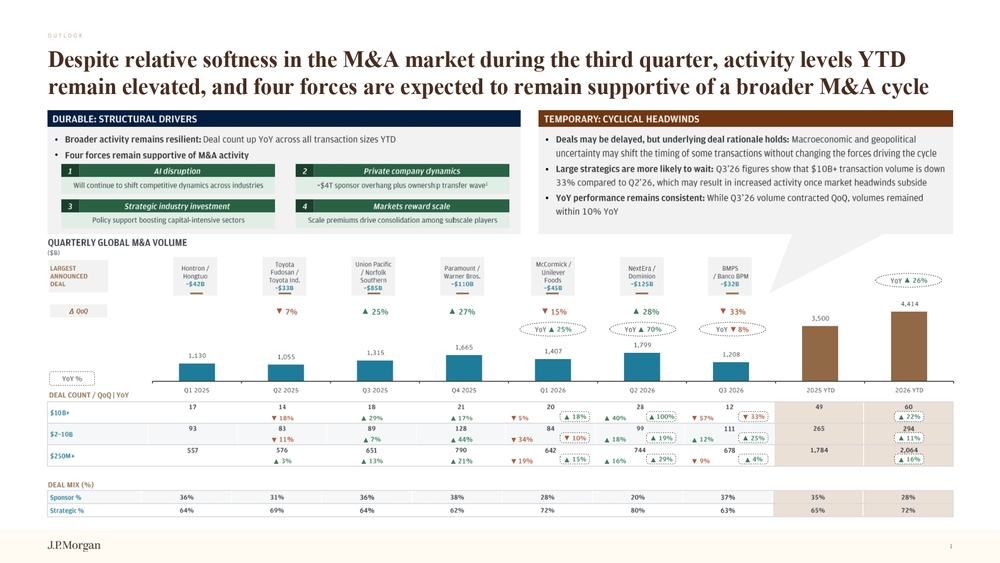
Despite relative softness in the M&A market during the third quarter, activity levels YTD remain elevated, and four forces are expected to remain supportive of a broader M&A cycle OUTLOOK 1 TEMPORARY: CYCLICAL HEADWINDS • Deals may be delayed, but underlying deal rationale holds: Macroeconomic and geopolitical uncertainty may shift the timing of some transactions without changing the forces driving the cycle • Large strategics are more likely to wait: Q3’ 26 figures show that $10B+ transaction volume is down 33% compare d to Q2 ’ 26 , which may result in increased activity once market headwinds subside • YoY performance remains consistent: While Q3’26 volume contracted QoQ, volumes remained within 10% YoY DURABLE: STRUCTURAL DRIVERS • Broader activity remains resilient: Deal count up YoY across all transaction sizes YTD • Four forces remain supportive of M&A activity 1,130 1,055 1,315 1,665 1,407 1,799 1,208 3,500 4,414 Q1 2025 Q2 2025 Q3 2025 Q4 2025 Q1 2026 Q2 2026 Q3 2026 2025 YTD 2026 YTD LARGEST ANNOUNCED DEAL Hontron / Hongtuo ~ $42B Toyota Fudosan / Toyota Ind. ~$33B Union Pacific / Norfolk Southern ~$85B Paramount / Warner Bros. ~$110B McCormick / Unilever Foods ~$45B NextEra / Dominion ~$125B BMPS / Banco BPM ~$32B ▼ 7% ▲ 25% ▲ 27% ▼ 15% ▲ 28% ▼ 33% YoY ▲ 25% YoY ▲ 70% YoY ▼ 8% YoY ▲ 26% DEAL COUNT / QoQ | YoY $10 B + 17 14 ▼ 18% 18 ▲ 29% 21 ▲ 17% 20 ▼ 5% 28 ▲ 40% 12 ▼ 57% 49 60 $2 – 10 B 93 83 ▼ 11% 89 ▲ 7% 128 ▲ 44% 84 ▼ 34% 99 ▲ 18% 111 ▲ 12% 265 294 $250 M + 557 576 ▲ 3% 651 ▲ 13% 790 ▲ 21% 642 ▼ 19% 744 ▲ 16% 678 ▼ 9% 1,784 2,064 DEAL MIX (%) Sponsor % 36% 31% 36% 38% 28% 20% 37% 35% 28% Strategic % 64% 69% 64% 62% 72% 80% 63% 65% 72%▲ 18% ▲ 100% ▼ 33% ▲ 22% ▼ 10% ▲ 19% ▲ 25% ▲ 11% ▲ 15% ▲ 29% ▲ 4% ▲ 16% QUARTERLY GLOBAL M&A VOLUME ($B) Will continue to shift competitive dynamics across industries ~$4T sponsor overhang plus ownership transfer wave 1 Policy support boosting capital
intensive sectors Scale premiums drive consolidation among subscale players AI disruption Strategic industry investment Markets reward scale Private company dynamics 1 3 2 4 YoY %Δ QoQ
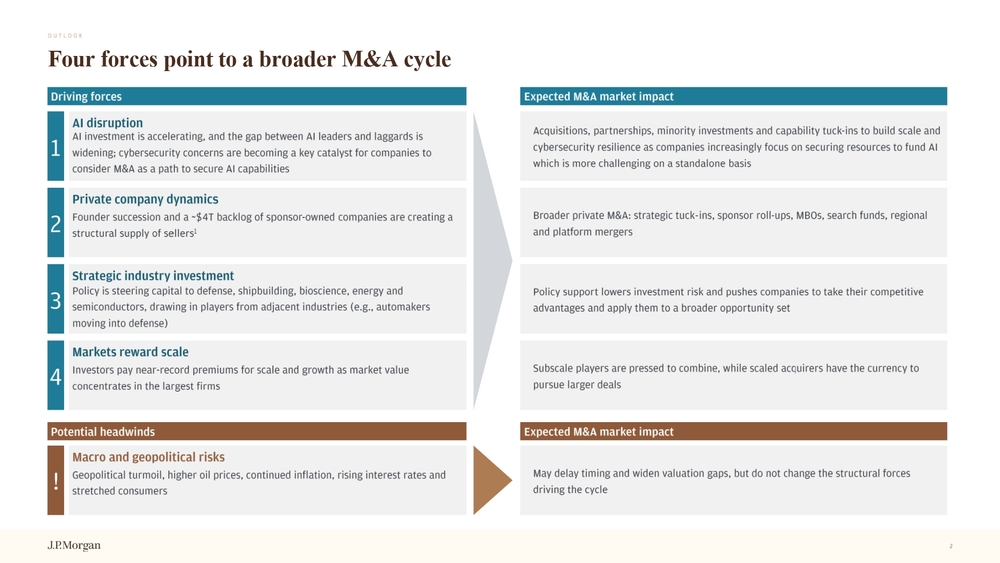
OUTLOOK Four forces point to a broader M&A cycle Driving forces Expected M&A market impact AI investment is accelerating, and the gap between AI leaders and laggards is widening; cybersecurity concerns are becoming a key catalyst for companies to consider M&A as a path to secure AI capabilities AI disruption Acquisitions, partnerships, minority investments and capability tuck
ins to build scale and cybersecurity resilience as companies increasingly focus on securing resources to fund AI which is more challenging on a standalone basis 1 Founder succession and a ~$4T backlog of sponsor
owned companies are creating a structural supply of sellers 1 Private company dynamics Broader private M&A: strategic tuck
ins, sponsor roll
ups, MBOs, search funds, regional and platform mergers 2 Policy support lowers investment risk and pushes companies to take their competitive advantages and apply them to a broader opportunity set 3 Markets reward scale Investors pay near
record premiums for scale and growth as market value concentrates in the largest firms 4 Subscale players are pressed to combine, while scaled acquirers have the currency to pursue larger deals Macro and geopolitical risks Geopolitical turmoil, higher oil prices, continued inflation, rising interest rates and stretched consumers ! May delay timing and widen valuation gaps, but do not change the structural forces driving the cycle Potential headwinds Expected M&A market impact Policy is steering capital to defense, shipbuilding, bioscience, energy and semiconductors, drawing in players from adjacent industries (e.g., automakers moving into defense) Strategic industry investment 2
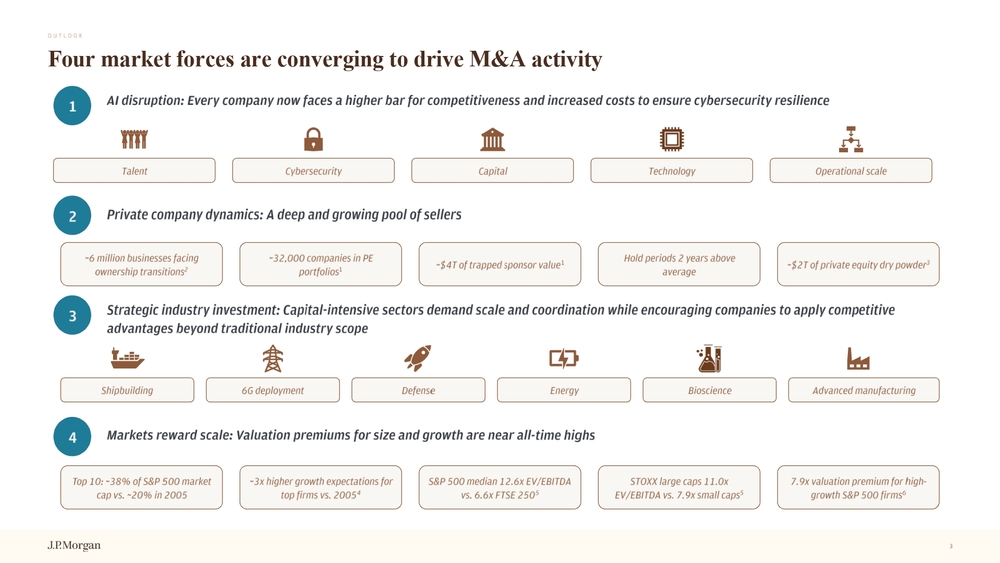
OUTLOOK Four market forces are converging to drive M&A activity AI disruption: Every company now faces a higher bar for competitiveness and increased costs to ensure cybersecurity resilienc e ~32,000 companies in PE portfolios 1 ~$4T of trapped sponsor value 1 Hold periods 2 years above average ~$2T of private equity dry powder 3 ~6 million businesses facing ownership transitions 2 6G deployment Defense Energy Bioscience Shipbuilding 1 2 3 Capital Technology Cybersecurity Operational scale Talent Private company dynamics: A deep and growing pool of sellers Strategic industry investment: Capital
intensive sectors demand scale and coordination while encouraging companies to apply comp etitive advantages beyond traditional industry scope Markets reward scale: Valuation premiums for size and growth are near all
time highs 4 Top 10: ~38% of S&P 500 market cap vs. ~20% in 2005 ~3x higher growth expectations for top firms vs. 2005 4 S&P 500 median 12.6x EV/EBITDA vs. 6.6x FTSE 250 5 STOXX large caps 11.0x EV/EBITDA vs. 7.9x small caps 5 7.9x valuation premium for high
growth S&P 500 firms 6 Advanced manufacturing 3
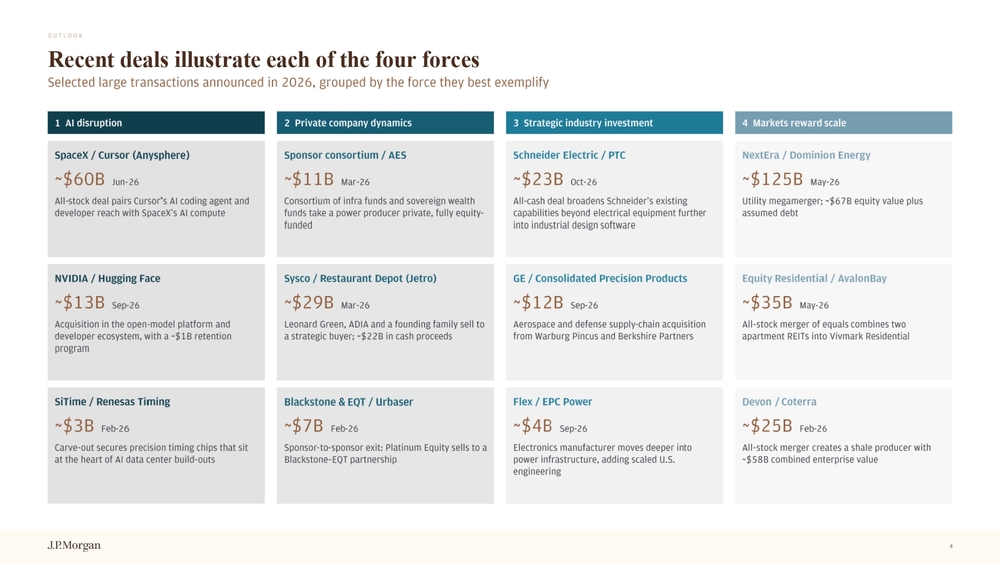
Recent deals illustrate each of the four forces OUTLOOK Selected large transactions announced in 2026, grouped by the force they best exemplify 1 AI disruption SpaceX / Cursor ( Anysphere ) ~ $60B Jun
26 All
stock deal pairs Cursor’s AI coding agent and developer reach with SpaceX’s AI compute NVIDIA / Hugging Face ~ $13B Sep
26 Acquisition in the open
model platform and developer ecosystem, with a ~$1B retention program 2 Private company dynamics Sysco / Restaurant Depot (Jetro) ~ $29B Mar
26 Leonard Green, ADIA and a founding family sell to a strategic buyer; ~$22B in cash proceeds 3 Strategic industry investment GE / Consolidated Precision Products ~ $12B Sep
26 Aerospace and defense supply
chain acquisition from Warburg Pincus and Berkshire Partners 4 Markets reward scale NextEra / Dominion Energy ~ $125B May
26 Utility megamerger; ~$67B equity value plus assumed debt Devon / Coterra ~ $25B Feb
26 All
stock merger creates a shale producer with ~$58B combined enterprise value Schneider Electric / PTC ~ $23B Oct
26 All
cash deal broadens Schneider’s existing capabilities beyond electrical equipment further into industrial design software Sponsor consortium / AES ~ $11B Mar
26 Consortium of infra funds and sovereign wealth funds take a power producer private, fully equity
funded Blackstone & EQT / Urbaser ~ $7B Feb
26 Sponsor
to
sponsor exit: Platinum Equity sells to a Blackstone – EQT partnership SiTime / Renesas Timing ~ $3B Feb
26 Carve
out secures precision timing chips that sit at the heart of AI data center build
outs Flex / EPC Power ~ $4B Sep
26 Electronics manufacturer moves deeper into power infrastructure, adding scaled U.S. engineering Equity Residential / AvalonBay ~ $35B May
26 All
stock merger of equals combines two apartment REITs into Vivmark Residential 4
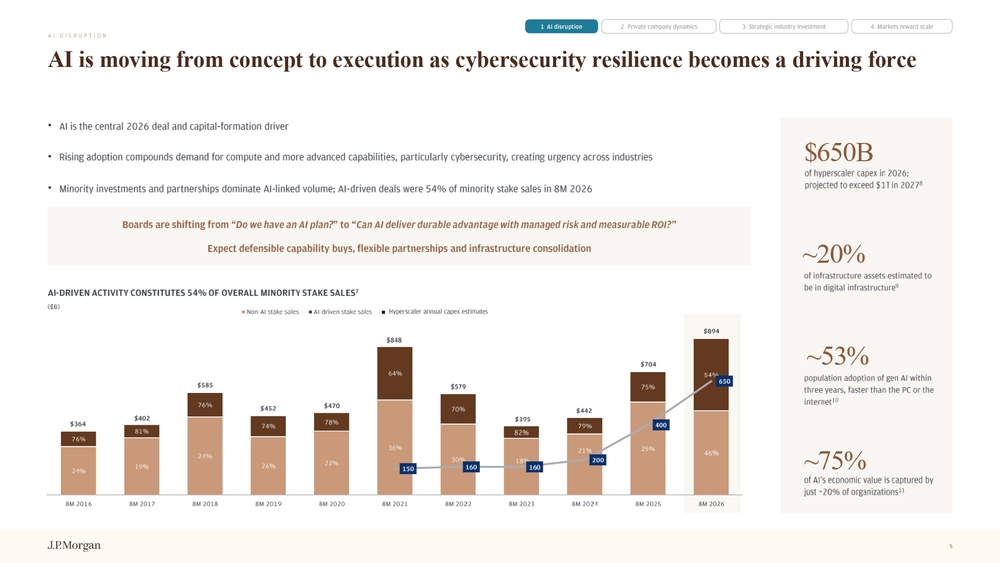
AI is moving from concept to execution as cybersecurity resilience becomes a driving force AI DISRUPTION • AI is the central 2026 deal and capital
formation driver • Rising adoption compounds demand for compute and more advanced capabilities, particularly cybersecurity, creating urgency acr oss industries • Minority investments and partnerships dominate AI
linked volume; AI
driven deals were 54% of minority stake sales in 8M 2026$650B of hyperscaler capex in 2026; projected to exceed $1T in 2027 8 ~20% of infrastructure assets estimated to be in digital infrastructure 9 ~53% population adoption of gen AI within three years, faster than the PC or the internet 10 ~75% of AI’s economic value is captured by just ~20% of organizations 11 AI
DRIVEN ACTIVITY CONSTITUTES 54% OF OVERALL MINORITY STAKE SAL ES 7 ($B) Boards are shifting from “ Do we have an AI plan? ” to “ Can AI deliver durable advantage with managed risk and measurable ROI? ” Expect defensible capability buys, flexible partnerships and infrastructure consolidation Hyperscaler annual capex estimates 1 AI disruption 2 Private company dynamics 3 Strategic industry investment 4 Markets reward scale $364 $402 $585 $452 $470 $848 $579 $395 $704 $894 24% 19% 24% 26% 22% 36% 30% 18% 21% 25% 46% 76% 81% 76% 74% 78% 64% 70% 82% 79% 75% 54% 150 160 160 200 400 650 8M 2016 8M 2017 8M 2018 8M 2019 8M 2020 8M 2021 8M 2022 8M 2023 8M 2024 8M 2025 8M 2026 Non-AI stake sales AI-driven stake sales $442 5
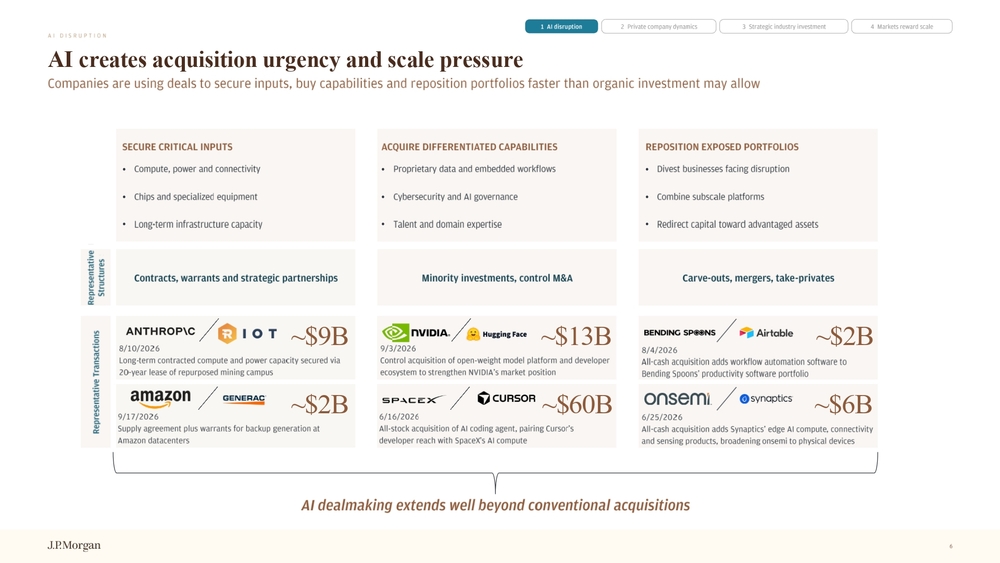
AI creates acquisition urgency and scale pressure AI DISRUPTION • Compute, power and connectivity • Chips and specialized equipment • Long
term infrastructure capacity AI dealmaking extends well beyond conventional acquisitions SECURE CRITICAL INPUTS Companies are using deals to secure inputs, buy capabilities and reposition portfolios faster than organic investment may all ow • Proprietary data and embedded workflows • Cybersecurity and AI governance • Talent and domain expertise ACQUIRE DIFFERENTIATED CAPABILITIES • Divest businesses facing disruption • Combine subscale platforms • Redirect capital toward advantaged assets REPOSITION EXPOSED PORTFOLIOS Contracts, warrants and strategic partnerships Representative Structures Minority investments, control M&A Carve
outs, mergers, take
privates
Representative Transactions
$2B
9/17/2026
Supply agreement plus warrants for backup generation at
Amazon datacenters$60B
6/16/2026
All
stock acquisition of AI coding agent, pairing Cursor’s developer reach with SpaceX’s AI compute~$9B 8/10/2026 Long
term contracted compute and power capacity secured via 20
year lease of repurposed mining campus~$13B 9/3/2026 Control acquisition of open
weight model platform and developer ecosystem to strengthen NVIDIA’s market position 1 AI disruption 2 Private company dynamics 3 Strategic industry investment 4 Markets reward scale ~$6B 6/25/2026 All
cash acquisition adds Synaptics’ edge AI compute, connectivity and sensing products, broadening onsemi to physical devices ~$2B 8/4/2026 All
cash acquisition adds workflow automation software to Bending Spoons’ productivity software portfolio 6
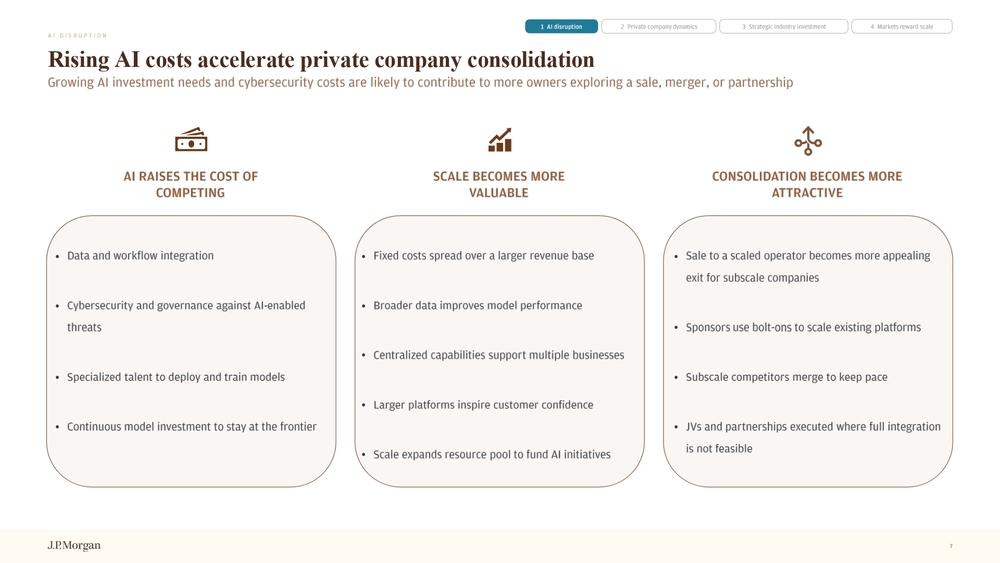
Rising AI costs accelerate private company consolidation AI DISRUPTION • Data and workflow integration • Cybersecurity and governance against AI
enabled threats • Specialized talent to deploy and train models • Continuous model investment to stay at the frontier AI RAISES THE COST OF COMPETING • Fixed costs spread over a larger revenue base • Broader data improves model performance • Centralized capabilities support multiple businesses • Larger platforms inspire customer confidence • Scale expands resource pool to fund AI initiatives SCALE BECOMES MORE VALUABLE • Sale to a scaled operator becomes more appealing exit for subscale companies • Sponsors use bolt
ons to scale existing platforms • Subscale competitors merge to keep pace • JVs and partnerships executed where full integration is not feasible CONSOLIDATION BECOMES MORE ATTRACTIVE Growing AI investment needs and cybersecurity costs are likely to contribute to more owners exploring a sale, merger, or part ner ship 1 AI disruption 2 Private company dynamics 3 Strategic industry investment 4 Markets reward scale 7
The ownership transfer wave expands the seller universe
PRIVATE COMPANY DYNAMICS
6M
U.S. SMBs face ownership
transitions by 2035 as founders
retire1M
Firms viewed as viable candidates
for a third
party sale or employee
ownership
$5T
Enterprise value in play as the
“business baton” passes to the next
generation of owners12M
Jobs tied to these businesses,
making successful handoffs critical
to the U.S. economy
Nearly every buyer type has a role in the ownership transfer wave
Key private company stats
2
✓
Strategic tuck
ins: Buying smaller competitors to expand geography or product lines ✓ Sponsor roll
ups: PE
backed consolidation of fragmented industries (e.g., insurance, HVAC, professional services) ✓ Search funds: Individual operators acquire and run a single SMB ✓ Management buyouts (MBOs): Existing leadership takes ownership ✓ Regional combinations: Mergers of peers to gain efficiency and share back
office costs ✓ Platform mergers: Strategic combinations specifically intended to create sufficient technology
investment capacity, including for AI and digital transformation 1 AI disruption 2 Private company dynamics 3 Strategic industry investment 4 Markets reward scale 8
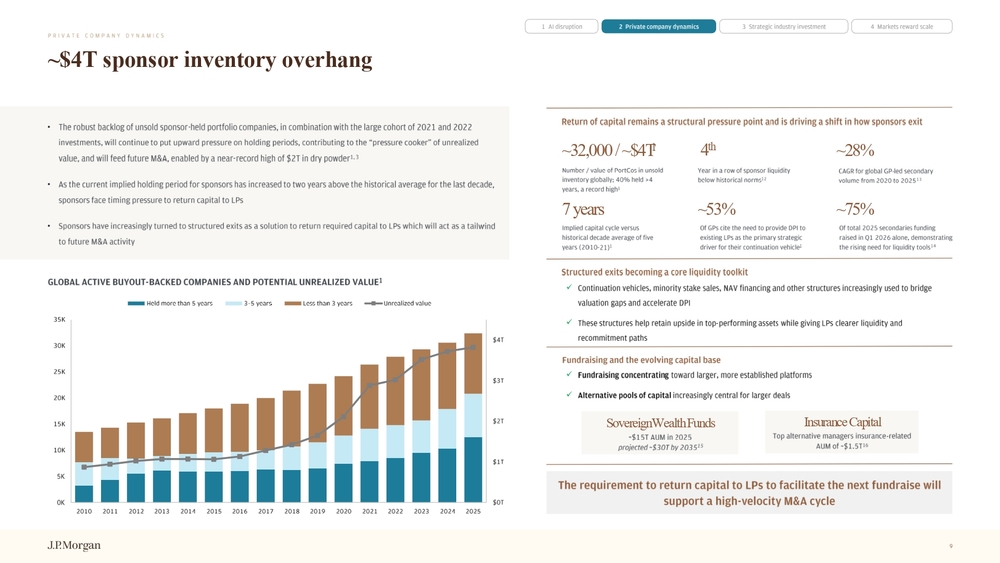
~$4T sponsor inventory overhang ~32,000 / ~$4T1 Number / value of PortCos in unsold inventory globally; 40% held >4 years, a record high 1 7 years Implied capital cycle versus historical decade average of five years (2010
14th Year in a row of sponsor liquidity below historical norms 12• The robust backlog of unsold sponsor
held portfolio companies, in combination with the large cohort of 2021 and 2022 investments, will continue to put upward pressure on holding periods, contributing to the “pressure cooker” of unrealized value, and will feed future M&A, enabled by a near
record high of $2T in dry powder 1, 3 • As the current implied holding period for sponsors has increased to two years above the historical average for the last decad e, sponsors face timing pressure to return capital to LPs • Sponsors have increasingly turned to structured exits as a solution to return required capital to LPs which will act as a tai lwi nd to future M&A activity Return of capital remains a structural pressure point and is driving a shift in how sponsors exit Structured exits becoming a core liquidity toolkit ✓ Continuation vehicles, minority stake sales, NAV financing and other structures increasingly used to bridge valuation gaps and accelerate DPI ✓ These structures help retain upside in top
performing assets while giving LPs clearer liquidity and recommitment paths ✓ Fundraising concentrating toward larger, more established platforms ✓ Alternative pools of capital increasingly central for larger deals Fundraising and the evolving capital base Sovereign W ealth Funds ~$15T AUM in 2025 projected ~$30T by 2035 15Insurance Capital Top alternative managers insurance
related AUM of ~$1.5T 16 GLOBAL ACTIVE BUYOUT
BACKED COMPANIES AND POTENTIAL UNREALIZED
VALUE
1
$0T
$1T
$2T
$3T
$4T
0K
5K
10K
15K
20K
25K
30K
35K
2010
2011
2012
2013
2014
2015
2016
2017
2018
2019
2020
2021
2022
2023
2024
2025
Held more than 5 years
3
–
5 years
Less than 3 years
Unrealized value75%
Of total 2025 secondaries funding
raised in Q1 2026 alone, demonstrating
the rising need for liquidity tools
1428%
CAGR for global GP
led secondary volume from 2020 to 2025 13 ~53% Of GPs cite the need to provide DPI to existing LPs as the primary strategic driver for their continuation vehicle 1 The requirement to return capital to LPs to facilitate the next fundraise will support a high
velocity M&A cycle PRIVATE COMPANY DYNAMICS 1 AI disruption 2 Private company dynamics 3 Strategic industry investment 4 Markets reward scale 9
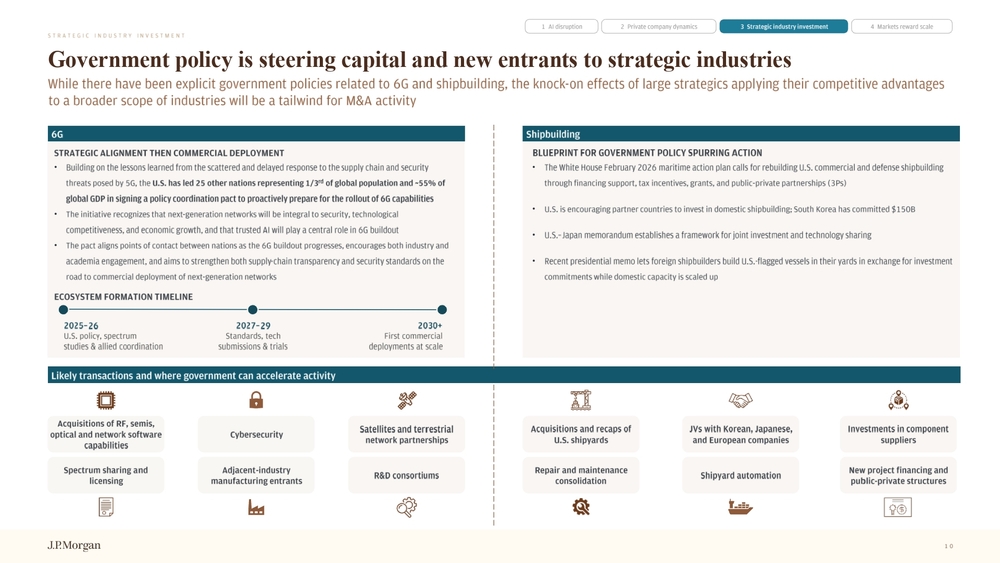
Government policy is steering capital and new entrants to strategic industries STRATEGIC INDUSTRY INVESTMENT Likely transactions and where government can accelerate activity Acquisitions of RF, semis, optical and network software capabilities Cybersecurity Satellites and terrestrial network partnerships Spectrum sharing and licensing Adjacent
industry manufacturing entrants R&D consortiums Acquisitions and recaps of U.S. shipyards JVs with Korean, Japanese, and European companies Investments in component suppliers Repair and maintenance consolidation Shipyard automation New project financing and public
private structures• Building on the lessons learned from the scattered and delayed response to the supply chain and security threats posed by 5G, the U.S. has led 25 other nations representing 1/3 rd of global population and ~55% of global GDP in signing a policy coordination pact to proactively prepare for the rollout of 6G capabilities • The initiative recognizes that next
generation networks will be integral to security, technological competitiveness, and economic growth, and that trusted AI will play a central role in 6G buildout • The pact aligns points of contact between nations as the 6G buildout progresses, encourages both industry and academia engagement, and aims to strengthen both supply
chain transparency and security standards on the road to commercial deployment of next
generation networks STRATEGIC ALIGNMENT THEN COMMERCIAL DEPLOYMENT • The White House February 2026 maritime action plan calls for rebuilding U.S. commercial and defense shipbuilding through financing support, tax incentives, grants, and public
private partnerships (3Ps) • U.S. is encouraging partner countries to invest in domestic shipbuilding; South Korea has committed $150B • U.S. – Japan memorandum establishes a framework for joint investment and technology sharing • Recent presidential memo lets foreign shipbuilders build U.S.
flagged vessels in their yards in exchange for investment commitments while domestic capacity is scaled up BLUEPRINT FOR GOVERNMENT POLICY SPURRING ACTION 6G Shipbuilding 2025 – 26 U.S. policy, spectrum studies & allied coordination 2027 – 29 Standards, tech submissions & trials 2030+ First commercial deployments at scale ECOSYSTEM FORMATION TIMELINE 1 AI disruption 2 Private company dynamics 3 Strategic industry investment 4 Markets reward scale While there have been explicit government policies related to 6G and shipbuilding, the knock
on effects of large strategics appl ying their competitive advantages to a broader scope of industries will be a tailwind for M&A activity 10
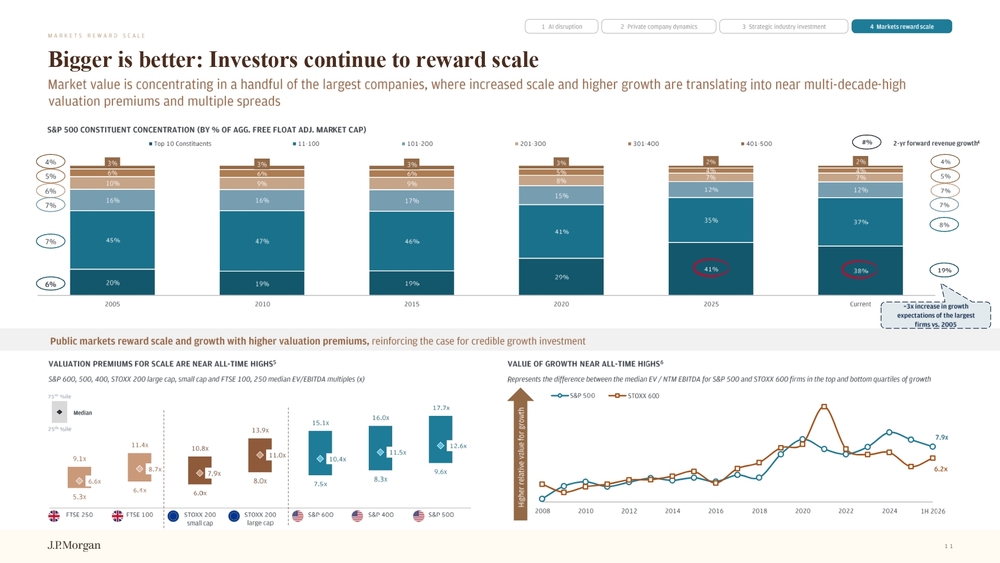
5.3x 6.4x 6.0x 8.0x 7.5x 8.3x 9.6x 9.1x 11.4x 10.8x 13.9x 15.1x 16.0x 17.7x 6.6x 8.7x 7.9x 11.0x 10.4x 11.5x 12.6x FTSE 250 FTSE 100 STOXX 200 small cap STOXX 200 large cap S&P 600 S&P 400 S&P 500Bigger is better: Investors continue to reward scale MARKETS REWARD SCALE 7.9x 6.2x 2008 2010 2012 2014 2016 2018 2020 2022 2024 1H 2026 S&P 500 STOXX 600 Higher relative value for growth VALUE OF GROWTH NEAR ALL
TIME HIGHS 6 VALUATION PREMIUMS FOR SCALE ARE NEAR ALL
TIME HIGHS 5 S&P 600, 500, 400, STOXX 200 large cap, small cap and FTSE 100, 250 median EV/EBITDA multiples (x) R epresents the difference between the median EV / NTM EBITDA for S&P 500 and STOXX 600 firms in the top and bottom quartiles o f g rowth 25 th % ile 75 th %ile Median Public markets reward scale and growth with higher valuation premiums, reinforcing the case for credible growth investment 20% 19% 19% 29% 41% 38% 45% 47% 46% 41% 35% 37% 16% 16% 17% 15% 12% 12% 10% 9% 9% 8% 7% 7% 6% 6% 6% 5% 4% 4% 3% 3% 3% 3% 2% 2% 2005 2010 2015 2020 2025 Current Top 10 Constituents 11-100 101-200 201-300 301-400 401-500 S&P 500 CONSTITUENT CONCENTRATION (BY % OF AGG. FREE FLOAT ADJ. MAR KET CAP) #% 2
yr forward revenue growth 4 4% 5% 7% 7% 8% 19% ~3x increase in growth expectations of the largest firms vs. 2005 4% 5% 6% 7% 7% 6% Market value is concentrating in a handful of the largest companies, where increased scale and higher growth are translating int o near multi
decade
high valuation premiums and multiple spreads 1 AI disruption 2 Private company dynamics 3 Strategic industry investment 4 Markets reward scale 11
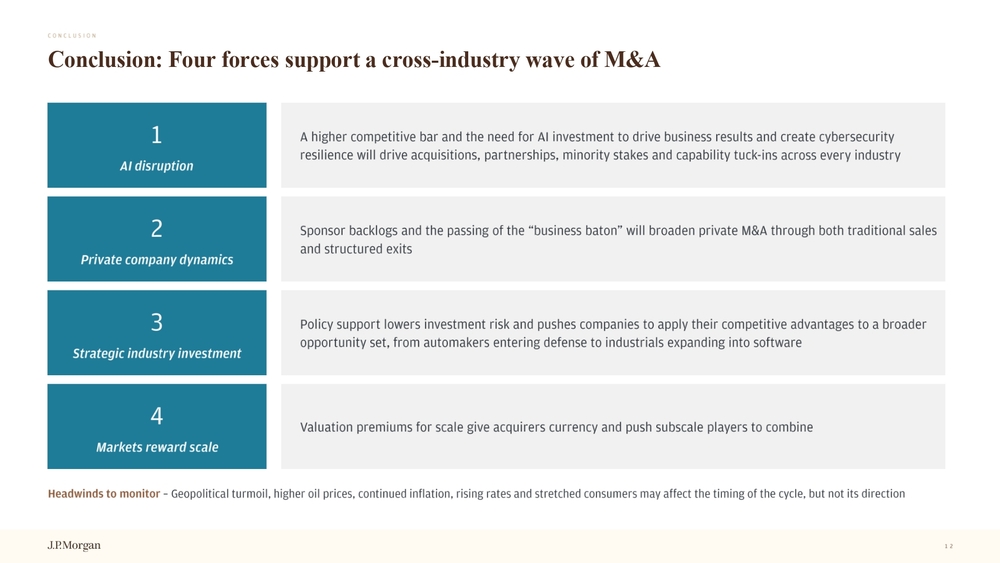
Conclusion: Four forces support a cross -industry wave of M&A A higher competitive bar and the need for AI investment to drive business results and create cybersecurity resilience will drive acquisitions, partnerships, minority stakes and capability tuck
ins across every industry 1 AI disruption Sponsor backlogs and the passing of the “business baton” will broaden private M&A through both traditional sales and structured exits 2 Private company dynamics Policy support lowers investment risk and pushes companies to apply their competitive advantages to a broader opportunity set, from automakers entering defense to industrials expanding into software 3 Strategic industry investment Valuation premiums for scale give acquirers currency and push subscale players to combine 4 Markets reward scale CONCLUSION Headwinds to monitor – G eopolitical turmoil, higher oil prices, continued inflation, rising rates and stretched consumers may affect the timing of th e c ycle, but not its direction 12
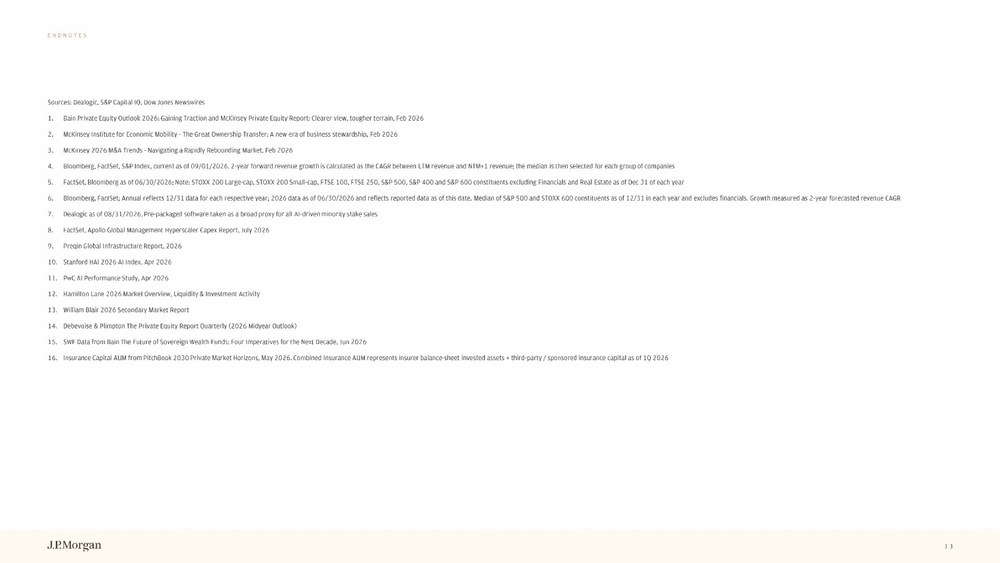
ENDNOTES Sources : Dealogic, S&P Capital IQ, Dow Jones Newswires 1. Bain Private Equity Outlook 2026 : Gaining Traction and McKinsey Private Equity Report : Clearer view, tougher terrain, Feb 2026 2. McKinsey Institute for Economic Mobility
The Great Ownership Transfer : A new era of business stewardship, Feb 2026 3. McKinsey 2026 M&A Trends
Navigating a Rapidly Rebounding Market, Feb 2026 4. Bloomberg, FactSet, S&P Index, current as of 09 / 01 / 2026 . 2
year forward revenue growth is calculated as the CAGR between LTM revenue and NTM+ 1 revenue ; the median is then selected for each group of companies 5. FactSet, Bloomberg as of 06 / 30 / 2026 ; Note : STOXX 200 Large
cap, STOXX 200 Small
cap, FTSE 100 , FTSE 250 , S&P 500 , S&P 400 and S&P 600 constituents excluding Financials and Real Estate as of Dec 31 of each year 6. Bloomberg, FactSet ; Annual reflects 12 / 31 data for each respective year ; 2026 data as of 06 / 30 / 2026 and reflects reported data as of this date . Median of S&P 500 and STOXX 600 constituents as of 12 / 31 in each year and excludes financials . Growth measured as 2
year forecasted revenue CAGR 7. Dealogic as of 08 / 31 / 2026 . Pre
packaged software taken as a broad proxy for all AI
driven minority stake sales 8. FactSet, Apollo Global Management Hyperscaler Capex Report, July 2026 9. Preqin Global Infrastructure Report, 2026 10. Stanford HAI 2026 AI Index, Apr 2026 11. PwC AI Performance Study, Apr 2026 12. Hamilton Lane 2026 Market Overview, Liquidity & Investment Activity 13. William Blair 2026 Secondary Market Report 14. Debevoise & Plimpton The Private Equity Report Quarterly ( 2026 Midyear Outlook) 15. SWF Data from Bain The Future of Sovereign Wealth Funds : Four Imperatives for the Next Decade, Jun 2026 16. Insurance Capital AUM from PitchBook 2030 Private Market Horizons, May 2026 . Combined Insurance AUM represents insurer balance
sheet invested assets + third
party / sponsored insurance capital as of 1 Q 2026 13
This presentation was prepared exclusively for the benefit and use of the J.P. Morgan client to whom it is directly addressed and delivered (including such client’s subsidiaries, the “Company”) in order t o a ssist the Company in evaluating, on a preliminary basis, the feasibility of a possible transaction or transactions and does not carry any right of publication or disclosure, in whole or in part, to any other party. This presentation is for dis cus sion purposes only and is incomplete without reference to, and should be viewed solely in conjunction with, the oral briefing pr ovided by J.P. Morgan. Neither this presentation nor any of its contents may be disclosed or used for any other purpose without the prior written consent of J.P. Morgan. Additionally, this presentation may contain content initially generated by AI or other automated technologies. The information in this presentation is based upon any management forecasts supplied to us and reflects prevailing conditions an d our views as of this date, all of which are accordingly subject to change. J.P. Morgan’s opinions and estimates constitute J.P. Morgan’s judgment and should be regarded as indicative, preliminary and for illustrative purposes only. In preparing this presentation, we have relied upon and assumed, without inde pen dent verification, the accuracy and completeness of all information available from public sources or which was provided to us by or on behalf of the Company or which was otherwise reviewed by us. In addition, our analyses are not and do not purport to be appraisals of the assets, stock, or business of the Compan y o r any other entity. J.P. Morgan makes no representations as to the actual value which may be received in connection with a transaction nor the legal, tax or accounting effects of consummating a transaction. Unless expressly contemplated hereby, the information in this presentation does not take into account the effec ts of a possible transaction or transactions involving an actual or potential change of control, which may have significant valu ati on and other effects. Notwithstanding anything herein to the contrary, the Company and each of its employees, representatives or other agents may d isc lose to any and all persons, without limitation of any kind, the U.S. federal and state income tax treatment and the U.S. fed era l and state income tax structure of the transactions contemplated hereby and all materials of any kind (including opinions or other tax analyses) that are provided to the Company re lating to such tax treatment and tax structure insofar as such treatment and/or structure relates to a U.S. federal or state inc ome tax strategy provided to the Company by J.P. Morgan. J.P. Morgan's policies on data privacy can be found at http://www.jpmorgan.com/pages/privacy. J.P. Morgan is a Registered FINRA member and as such, is generally not permitted to utilize the firm's research capabilities in pitching for investment banking business. All views contained in this presentation are the views of J.P. Morgan’s Investment Bank, not the Research Department. J.P. Mo rg an’s policies prohibit employees from offering, directly or indirectly, a favorable research rating or specific price target, or offering to change a r ating or price target, to a subject company as consideration or inducement for the receipt of business or for compensation. J .P. Morgan also prohibits its research analysts from being compensated for involvement in investment banking transactions except to the extent that such participation is intended to benefit investors. Changes to Interbank Offered Rates (IBORs) and other benchmark rates: Certain interest rate benchmarks are, or may in the future become, subject to ongoing international, national and other regul ato ry guidance, reform and proposals for reform. For more information, please consult: https://www.jpmorgan.com/global/disclosures/interbank_offered_rates JPMorgan Chase & Co. and its affiliates do not provide tax advice. Accordingly, any discussion of U.S. tax matters included h ere in (including any attachments) is not intended or written to be used, and cannot be used, in connection with the promotion, m ark eting or recommendation by anyone not affiliated with JPMorgan Chase & Co. of any of the matters addressed herein or for the purpose of avoiding U.S. tax
related penalties. J.P. Morgan is a marketing name for investment businesses of JPMorgan Chase & Co. and its subsidiaries and affiliates worldwide. S ecu rities, syndicated loan arranging, financial advisory, lending, derivatives and other investment banking and commercial banki ng activities are performed by a combination of J.P. Morgan Securities LLC, J.P. Morgan Securities plc, J.P. Morgan SE, JPMorgan Chase Bank, N.A. and the appropriately licensed subsidia rie s and affiliates of JPMorgan Chase & Co. worldwide. J.P. Morgan deal team members may be employees of any of the foregoing entities. J.P. Morgan Securities plc is authorized by the Prudential Regulation Authority and regulated by the Financial Conduct Authority and the Prudential Regulation Authority. J.P. Morgan SE is authorised as a credit institution by the German Federal Financial Supervisory Authority ( Bundesanstalt für Finanzdienstleistungsaufsicht , BaFin) and jointly supervised by the BaFin, the German Central Bank (Deutsche Bundesbank) and the European Central Bank (ECB). For information on any J.P. Morgan German legal entity see: https://www.jpmorgan.com/country/US/en/disclosures/legal
entity
information#germany . For information on any other J.P. Morgan legal entity see: https://www.jpmorgan.com/country/GB/EN/disclosures/investment
bank
legal
entity
disclosures . JPMS LLC intermediates securities transactions effected by its non
U.S. affiliates for or with its U.S. clients when appropriate and in accordance with Rule 15a
6 under the Securities Exchange Act of 1934. Please consult: www.jpmorgan.com/securities
transactions This presentation does not constitute a commitment by any J.P. Morgan entity to underwrite, subscribe for or place any securities or to extend or arrange credit or to provide any other ser vic es. Copyright 202 6 JPMorgan Chase & Co. All rights reserved. JPMorgan Chase Bank, N.A., organized under the laws of U.S.A. with limited liability. DISCLAIMER 14