Agriculture Traders Working Capital Index 2026
by JPMorgan
J.P. Morgan Payments | Global Advisory | 2026 A G R I C U LT U R E T R A D E R S W O R K I N G C A P I TA L I N D E X
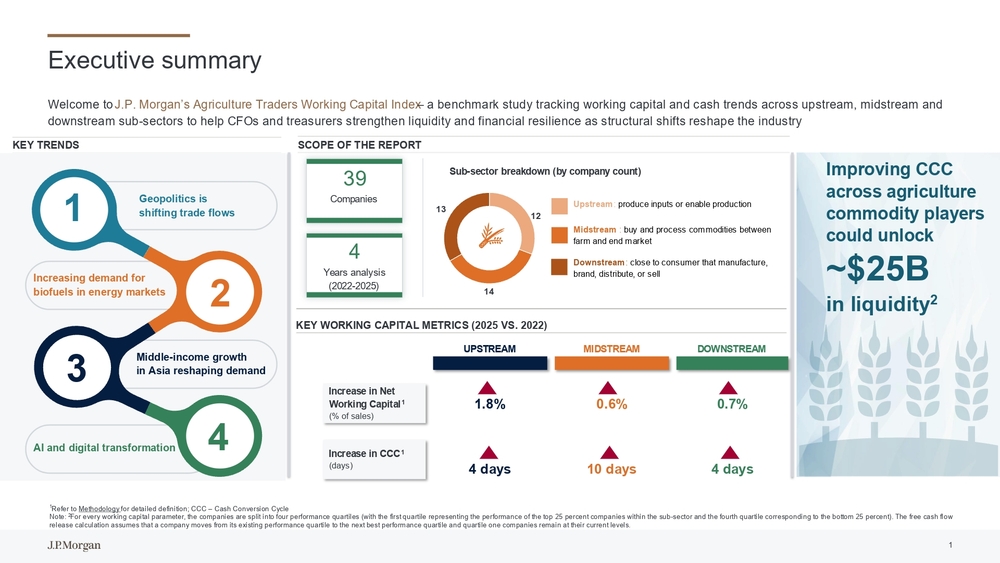
Executive summary UPSTREAM MIDSTREAM DOWNSTREAM Increase in Net Working Capital1 (% of sales)1.8% 0.6% 0.7% Increase in CCC1 (days)4 days 10 days 4 days 12 1413Upstream :produce inputs or enable production Midstream : buy and process commodities between farm and end market Downstream :close to consumer thatmanufacture, brand, distribute, or sellSub-sector breakdown (by company count) KEY WORKING CAPITAL METRICS (2025 VS. 2022)SCOPE OF THE REPORT 4 Years analysis (2022 -2025) 39 Companies Geopolitics is shifting trade flows Middle -income growth in Asia reshaping demand AI and digital transformationIncreasing demand for biofuels in energy markets1 2 3 4 KEY TRENDS Welcome to J.P. Morgan’s Agriculture Traders Working Capital Index –a benchmark study tracking working capital and cash trends across upstream, midstream and downstream sub -sectors to help CFOs and treasurers strengthen liquidity and financial resilience as structural shifts reshape th e industry 1Refer to Methodology for detailed definition; CCC –Cash Conversion Cycle Note: 2For every working capital parameter, the companies are split into four performance quartiles (with the first quartile represe nting the performance of the top 25 percent companies within the sub -sector and the fourth quartile corresponding to the bottom 25 percent). The free cash flow release calculation assumes that a company moves from its existing performance quartile to the next best performance quartile and quartile one companies remain at their current levels. Improving CCC across agriculture commodity players could unlock ~$25B in liquidity2 1
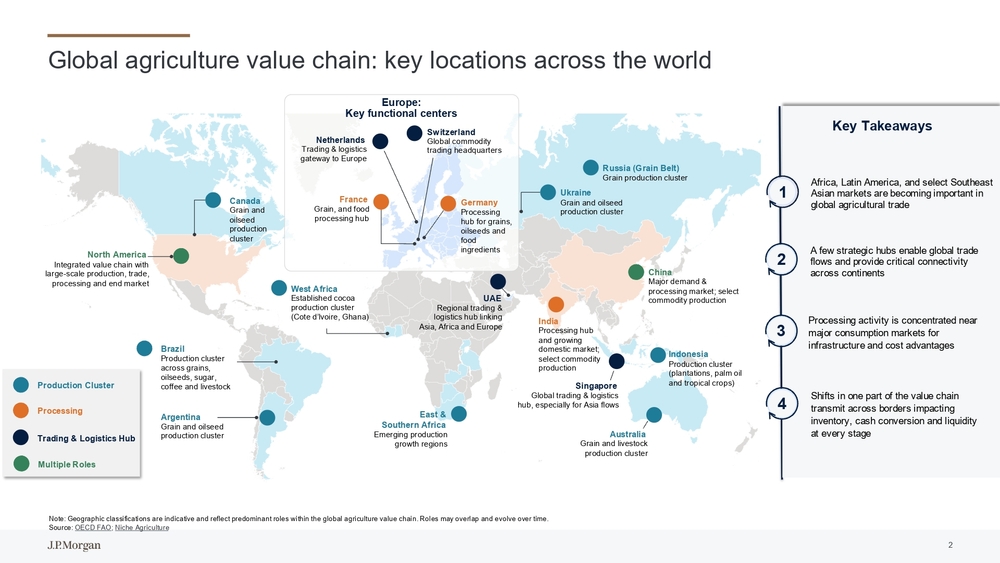
Global agriculture value chain: key locations across the world Key Takeaways 4Shifts in one part of the value chain transmit across borders impacting inventory, cash conversion and liquidity at every stage1 2A few strategic hubs enable global trade flows and provide critical connectivity across continents 3Processing activity is concentrated near major consumption markets for infrastructure and cost advantages Production Cluster Processing Trading & Logistics Hub Multiple RolesCanada Grain and oilseed production cluster North America Integrated value chain with large -scale production, trade, processing and end market Brazil Production cluster across grains, oilseeds, sugar, coffee and livestock Argentina Grain and oilseed production clusterWest Africa Established cocoa production cluster (Cote d’lvoire, Ghana) East & Southern Africa Emerging production growth regionsUAE Regional trading & logistics hub linking Asia, Africa and EuropeUkraine Grain and oilseed production clusterRussia (Grain Belt) Grain production cluster China Major demand & processing market; select commodity production India Processing hub and growing domestic market; select commodity production Singapore Global trading & logistics hub, especially for Asia flows Australia Grain and livestock production clusterIndonesia Production cluster (plantations, palm oil and tropical crops)Europe: Key functional centers Netherlands Trading & logistics gateway to EuropeSwitzerland Global commodity trading headquarters France Grain, and food processing hubGermany Processing hub for grains, oilseeds and food ingredients Note: Geographic classifications are indicative and reflect predominant roles within the global agriculture value chain. Role s may overlap and evolve over time. Source: OECD FAO ; Niche AgricultureAfrica, Latin America, and select Southeast Asian markets are becoming important in global agricultural trade 2
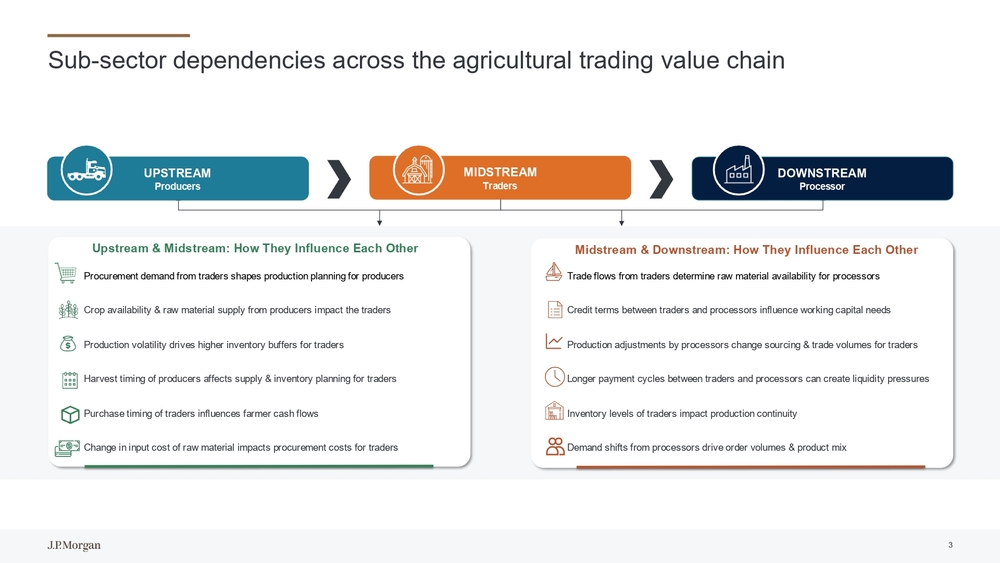
Sub-sector dependencies across the agricultural trading value chain UPSTREAM ProducersMIDSTREAM TradersDOWNSTREAM Processor Upstream & Midstream: How They Influence Each Other Midstream & Downstream: How They Influence Each Other Procurement demand from traders shapes production planning for producers Crop availability & raw material supply from producers impact the traders Production volatility drives higher inventory buffers for traders Harvest timing of producers affects supply & inventory planning for traders Purchase timing of traders influences farmer cash flows Change in input cost of raw material impacts procurement costs for traders Trade flows from traders determine raw material availability for processors Credit terms between traders and processors influence working capital needs Production adjustments by processors change sourcing & trade volumes for traders Longer payment cycles between traders and processors can create liquidity pressures Inventory levels of traders impact production continuity Demand shifts from processors drive order volumes & product mix 3
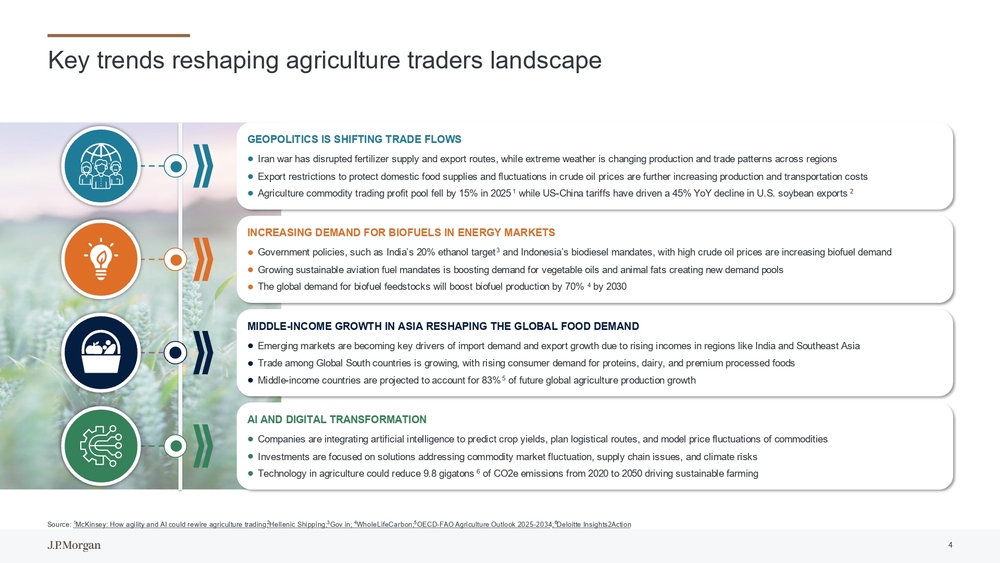
Key trends reshaping agriculture traders landscape GEOPOLITICS IS SHIFTING TRADE FLOWS ⚫Iran war has disrupted fertilizer supply and export routes, while extreme weather is changing production and trade patterns a cross regions ⚫Export restrictions to protect domestic food supplies and fluctuations in crude oil prices are further increasing production andtransportation costs ⚫Agriculture commodity trading profit pool fell by 15% in 20251while US -China tariffs have driven a 45% YoY decline in U.S. soybean exports2 INCREASING DEMAND FOR BIOFUELS IN ENERGY MARKETS ⚫Government policies, such as India’s 20% ethanol target3and Indonesia’s biodiesel mandates, with high crude oil prices are increasing biofuel demand ⚫Growing sustainable aviation fuel mandates is boosting demand for vegetable oils and animal fats creating new demand pools ⚫The global demand for biofuel feedstocks will boost biofuel production by 70%4by 2030 MIDDLE -INCOME GROWTH IN ASIA RESHAPING THE GLOBAL FOOD DEMAND ⚫Emerging markets are becoming key drivers of import demand and export growth due to rising incomes in regions like India and Southeast Asia ⚫Trade among Global South countries is growing, with rising consumer demand for proteins, dairy, and premium processed foods ⚫Middle -income countries are projected to account for 83%5of future global agriculture production growth AI AND DIGITAL TRANSFORMATION ⚫Companies are integrating artificial intelligence to predict crop yields, plan logistical routes, and model price fluctuation s of commodities ⚫Investments are focused on solutions addressing commodity market fluctuation, supply chain issues, and climate risks ⚫Technology in agriculture could reduce 9.8 gigatons6of CO2e emissions from 2020 to 2050 driving sustainable farming Source: 1McKinsey: How agility and AI could rewire agriculture trading ; 2Hellenic Shipping; 3Gov in; 4WholeLifeCarbon;5OECD -FAO Agriculture Outlook 2025 -2034 ;6Deloitte Insights2Action 4
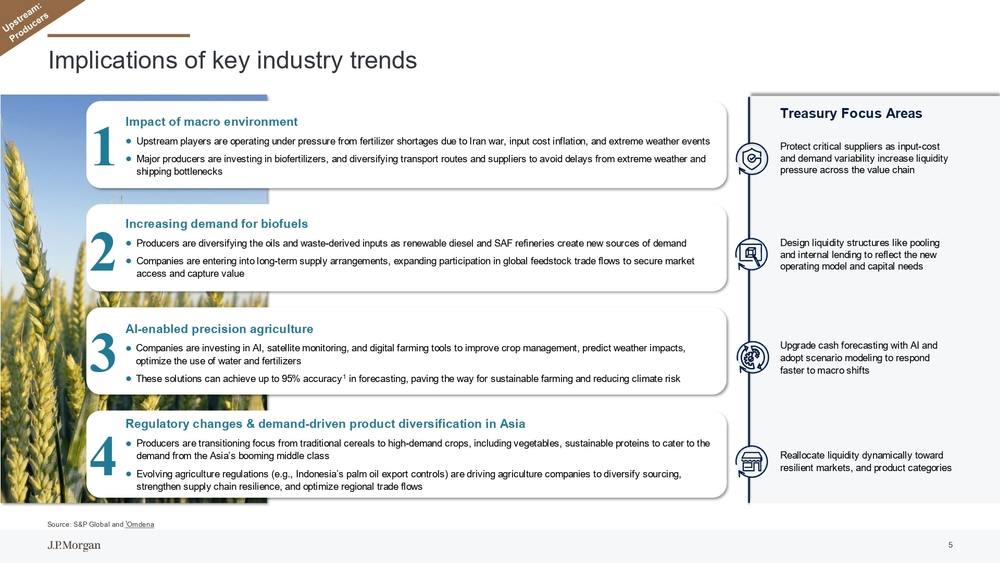
Implications of key industry trends 1Impact of macro environment ⚫Upstream players are operating under pressure from fertilizer shortages due to Iran war, input cost inflation, and extreme we ather events ⚫Major producers are investing in biofertilizers, and diversifying transport routes and suppliers to avoid delays from extreme weather and shipping bottlenecks 2Increasing demand for biofuels ⚫Producers are diversifying the oils and waste -derived inputs as renewable diesel and SAF refineries create new sources of demand ⚫Companies are entering into long -term supply arrangements, expanding participation in global feedstock trade flows to secure mar ket access and capture value 3AI-enabled precision agriculture ⚫Companies are investing in AI, satellite monitoring, and digital farming tools to improve crop management, predict weather im pacts, optimize the use of water and fertilizers ⚫These solutions can achieve up to 95% accuracy1in forecasting, paving the way for sustainable farming and reducing climate risk 4Regulatory changes & demand -driven product diversification in Asia ⚫Producers are transitioning focus from traditional cereals to high -demand crops, including vegetables, sustainable proteins to c ater to the demand from the Asia’s booming middle class ⚫Evolving agriculture regulations (e.g., Indonesia’s palm oil export controls) are driving agriculture companies to diversify sourcing, strengthen supply chain resilience, and optimize regional trade flows Treasury Focus Areas Protect critical suppliers as input -cost and demand variability increase liquidity pressure across the value chain Design liquidity structures like pooling and internal lending to reflect the new operating model and capital needs Reallocate liquidity dynamically toward resilient markets, and product categoriesUpgrade cash forecasting with AI and adopt scenario modeling to respond faster to macro shifts Source: S&P Global and 1Omdena 5
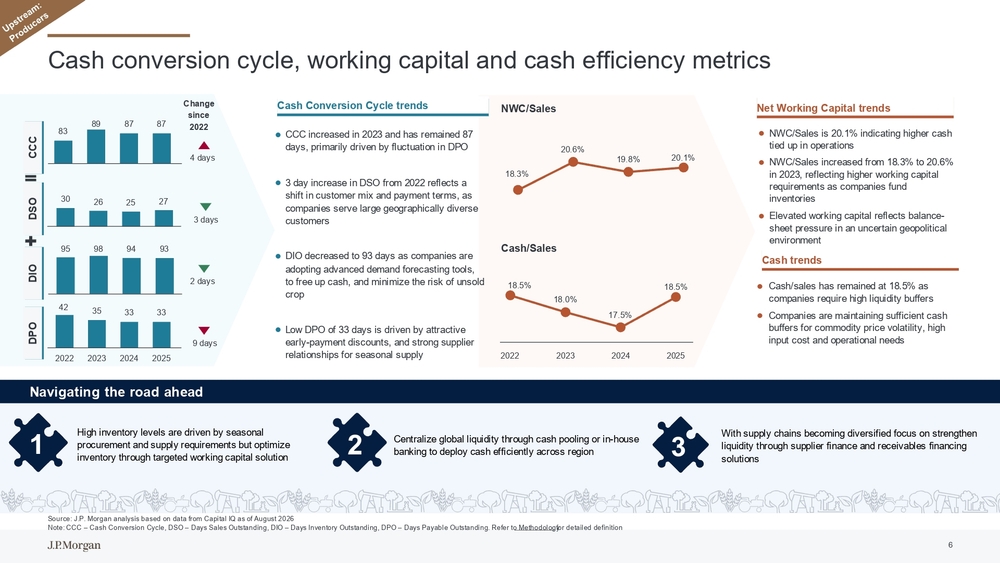
Cash conversion cycle, working capital and cash efficiency metrics Cash Conversion Cycle trends 8389 87 87 3026 25 27 95 98 94 93CCC DIO DSOChange since 2022 4 days 2 days 9daysDPO⚫CCC increased in 2023 and has remained 87 days, primarily driven by fluctuation in DPO ⚫3 day increase in DSO from 2022 reflects a shift in customer mix and payment terms, as companies serve large geographically diverse customers ⚫DIO decreased to 93 days as companies are adopting advanced demand forecasting tools, to free up cash, and minimize the risk of unsold crop ⚫Low DPO of 33 days is driven by attractive early -payment discounts, and strong supplier relationships for seasonal supplyNet Working Capital trends NWC/Sales Cash/Sales 18.5% 18.0% 17.5%18.5% 2022 2023 2024 2025⚫NWC/Sales is 20.1% indicating higher cash tied up in operations ⚫NWC/Sales increased from 18.3% to 20.6% in 2023, reflecting higher working capital requirements as companies fund inventories ⚫Elevated working capital reflects balance - sheet pressure in an uncertain geopolitical environment Cash trends ⚫Cash/sales has remained at 18.5% as companies require high liquidity buffers ⚫Companies are maintaining sufficient cash buffers for commodity price volatility, high input cost and operational needs Navigating the road ahead 1 2 3High inventory levels are driven by seasonal procurement and supply requirements but optimize inventory through targeted working capital solutionCentralize global liquidity through cash pooling or in -house banking to deploy cash efficiently across region With supply chains becoming diversified focus on strengthen liquidity through supplier finance and receivables financing solutions3days Source: J.P. Morgan analysis based on data from Capital IQ as of August 2026 Note: CCC –Cash Conversion Cycle, DSO –Days Sales Outstanding, DIO –Days Inventory Outstanding, DPO –Days Payable Outstandin g. Refer to Methodology for detailed definition18.3%20.6% 19.8% 20.1% 4235 33 33 2022 2023 2024 2025 6
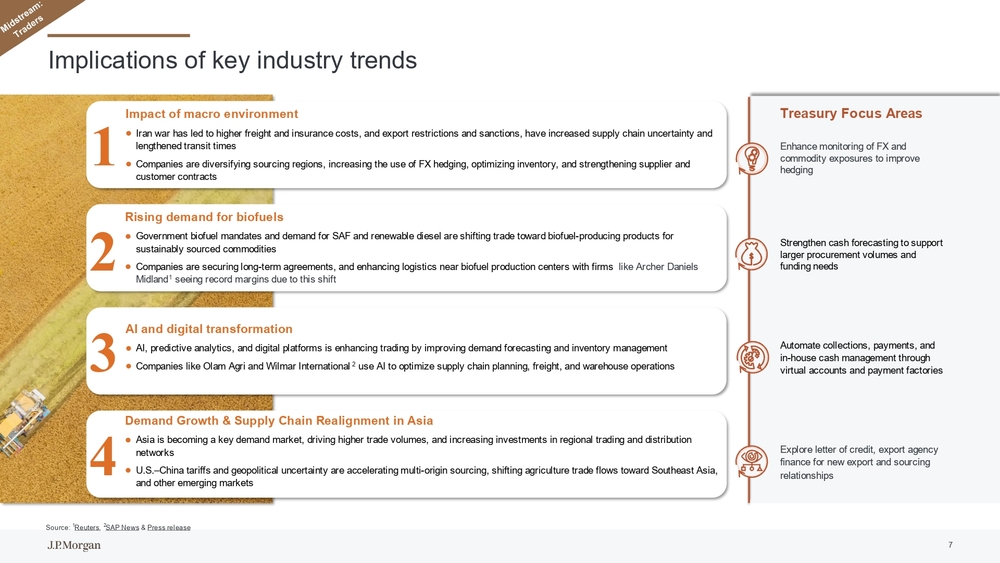
Implications of key industry trends 1Impact of macro environment ⚫Iran war has led to higher freight and insurance costs, and export restrictions and sanctions, have increased supply chain un certainty and lengthened transit times ⚫Companies are diversifying sourcing regions, increasing the use of FX hedging, optimizing inventory, and strengthening suppli er and customer contracts 2Rising demand for biofuels ⚫Government biofuel mandates and demand for SAF and renewable diesel are shifting trade toward biofuel -producing products for sustainably sourced commodities ⚫Companies are securing long -term agreements, and enhancing logistics near biofuel production centers with firms like Archer Daniels Midland1seeing record margins due to this shift 3AI and digital transformation ⚫AI, predictive analytics, and digital platforms is enhancing trading by improving demand forecasting and inventory management ⚫Companies like Olam Agri and Wilmar International2use AI to optimize supply chain planning, freight, and warehouse operations 4Demand Growth & Supply Chain Realignment in Asia ⚫Asia is becoming a key demand market, driving higher trade volumes, and increasing investments in regional trading and distri bution networks ⚫U.S.–China tariffs and geopolitical uncertainty are accelerating multi -origin sourcing, shifting agriculture trade flows toward Southeast Asia, and other emerging markets Treasury Focus Areas Enhance monitoring of FX and commodity exposures to improve hedging Strengthen cash forecasting to support larger procurement volumes and funding needs Explore letter of credit, export agency finance for new export and sourcing relationshipsAutomate collections, payments, and in-house cash management through virtual accounts and payment factories Source: 1Reuters , 2SAP News & Press release 7
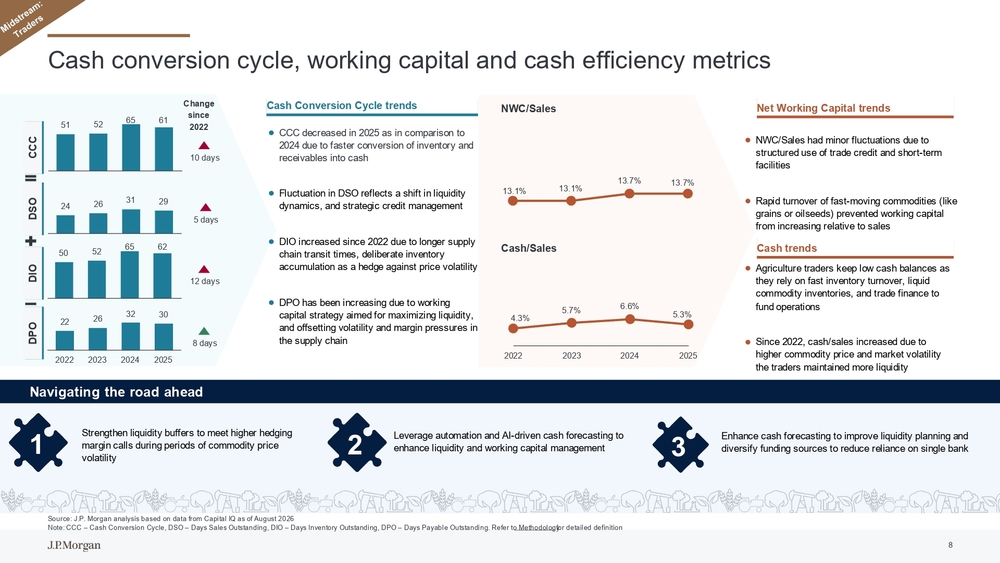
50 5265 62Cash conversion cycle, working capital and cash efficiency metrics Cash Conversion Cycle trends 51 5265 61 24 2631 29 222632 30 2022 2023 2024 2025CCC DIO DSOChange since 2022DPO⚫CCC decreased in 2025 as in comparison to 2024 due to faster conversion of inventory and receivables into cash ⚫Fluctuation in DSO reflects a shift in liquidity dynamics, and strategic credit management ⚫DIO increased since 2022 due to longer supply chain transit times, deliberate inventory accumulation as a hedge against price volatility ⚫DPO has been increasing due to working capital strategy aimed for maximizing liquidity, and offsetting volatility and margin pressures in the supply chainNet Working Capital trends NWC/Sales Cash/Sales13.1%13.1%13.7% 13.7% 4.3%5.7%6.6% 5.3% 2022 2023 2024 2025Cash trends Navigating the road ahead 1 2 3Strengthen liquidity buffers to meet higher hedging margin calls during periods of commodity price volatilityLeverage automation and AI -driven cash forecasting to enhance liquidity and working capital managementEnhance cash forecasting to improve liquidity planning and diversify funding sources to reduce reliance on single bank ⚫NWC/Sales had minor fluctuations due to structured use of trade credit and short -term facilities ⚫Rapid turnover of fast -moving commodities (like grains or oilseeds) prevented working capital from increasing relative to sales ⚫Agriculture traders keep low cash balances as they rely on fast inventory turnover, liquid commodity inventories, and trade finance to fund operations ⚫Since 2022, cash/sales increased due to higher commodity price and market volatility the traders maintained more liquidity Source: J.P. Morgan analysis based on data from Capital IQ as of August 2026 Note: CCC –Cash Conversion Cycle, DSO –Days Sales Outstanding, DIO –Days Inventory Outstanding, DPO –Days Payable Outstandin g. Refer to Methodology for detailed definition10 days 12 days 8days5days 8
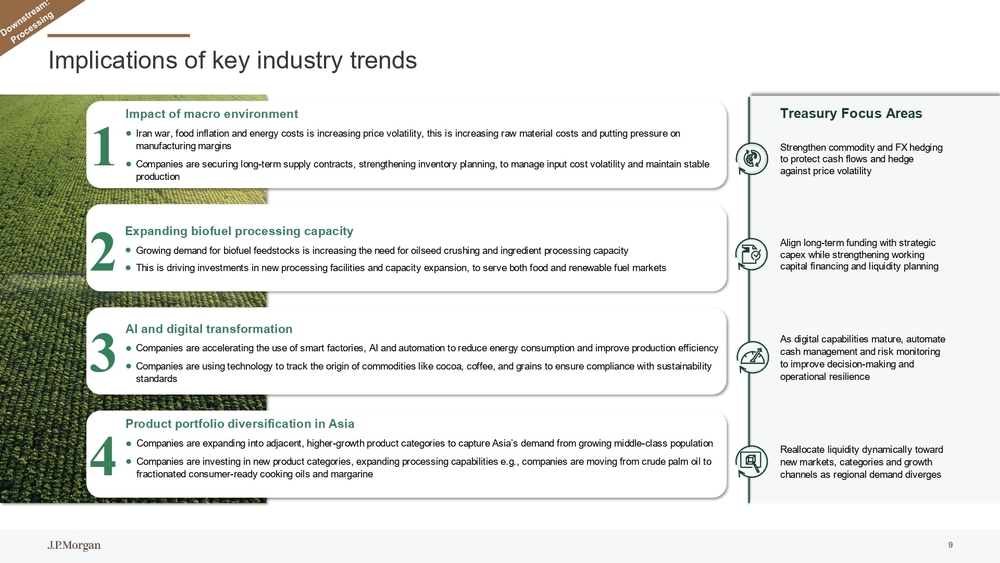
Implications of key industry trends 1Impact of macro environment ⚫Iran war, food inflation and energy costs is increasing price volatility, this is increasing raw material costs and putting p ressure on manufacturing margins ⚫Companies are securing long -term supply contracts, strengthening inventory planning, to manage input cost volatility and maintai n stable production 2Expanding biofuel processing capacity ⚫Growing demand for biofuel feedstocks is increasing the need for oilseed crushing and ingredient processing capacity ⚫This is driving investments in new processing facilities and capacity expansion, to serve both food and renewable fuel market s 3AI and digital transformation ⚫Companies are accelerating the use of smart factories, AI and automation to reduce energy consumption and improve production efficiency ⚫Companies are using technology to track the origin of commodities like cocoa, coffee, and grains to ensure compliance with su stainability standards 4Product portfolio diversification in Asia ⚫Companies are expanding into adjacent, higher -growth product categories to capture Asia’s demand from growing middle -class popul ation ⚫Companies are investing in new product categories, expanding processing capabilities e.g., companies are moving from crude pa lm oil to fractionated consumer -ready cooking oils and margarine Treasury Focus Areas Strengthen commodity and FX hedging to protect cash flows and hedge against price volatility Align long -term funding with strategic capex while strengthening working capital financing and liquidity planning Reallocate liquidity dynamically toward new markets, categories and growth channels as regional demand divergesAs digital capabilities mature, automate cash management and risk monitoring to improve decision -making and operational resilience 9
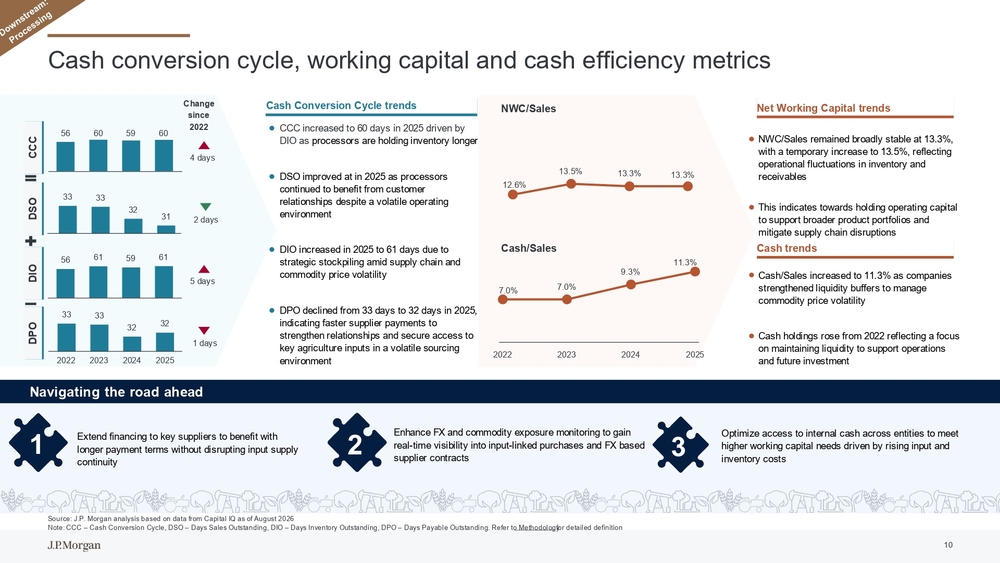
33 33 3231Cash conversion cycle, working capital and cash efficiency metrics Cash Conversion Cycle trends 56 60 59 60 5661 59 61 33 33 3232 2022 2023 2024 2025CCC DIO DSO DPONet Working Capital trends NWC/Sales Cash/Sales12.6%13.5% 13.3% 13.3% Cash trends Navigating the road ahead 1 2 3Extend financing to key suppliers to benefit with longer payment terms without disrupting input supply continuityEnhance FX and commodity exposure monitoring to gain real-time visibility into input -linked purchases and FX based supplier contractsOptimize access to internal cash across entities to meet higher working capital needs driven by rising input and inventory costs⚫CCC increased to 60 days in 2025 driven by DIO as processors are holding inventory longer ⚫DSO improved at in 2025 as processors continued to benefit from customer relationships despite a volatile operating environment ⚫DIO increased in 2025 to 61 days due to strategic stockpiling amid supply chain and commodity price volatility ⚫DPO declined from 33 days to 32 days in 2025, indicating faster supplier payments to strengthen relationships and secure access to key agriculture inputs in a volatile sourcing environment⚫NWC/Sales remained broadly stable at 13.3%, with a temporary increase to 13.5%, reflecting operational fluctuations in inventory and receivables ⚫This indicates towards holding operating capital to support broader product portfolios and mitigate supply chain disruptions ⚫Cash/Sales increased to 11.3% as companies strengthened liquidity buffers to manage commodity price volatility ⚫Cash holdings rose from 2022 reflecting a focus on maintaining liquidity to support operations and future investment7.0%7.0%9.3%11.3% 2022 2023 2024 2025 Source: J.P. Morgan analysis based on data from Capital IQ as of August 2026 Note: CCC –Cash Conversion Cycle, DSO –Days Sales Outstanding, DIO –Days Inventory Outstanding, DPO –Days Payable Outstandin g. Refer to Methodology for detailed definition4 days 5 days 1 days2 daysChange since 2022 10
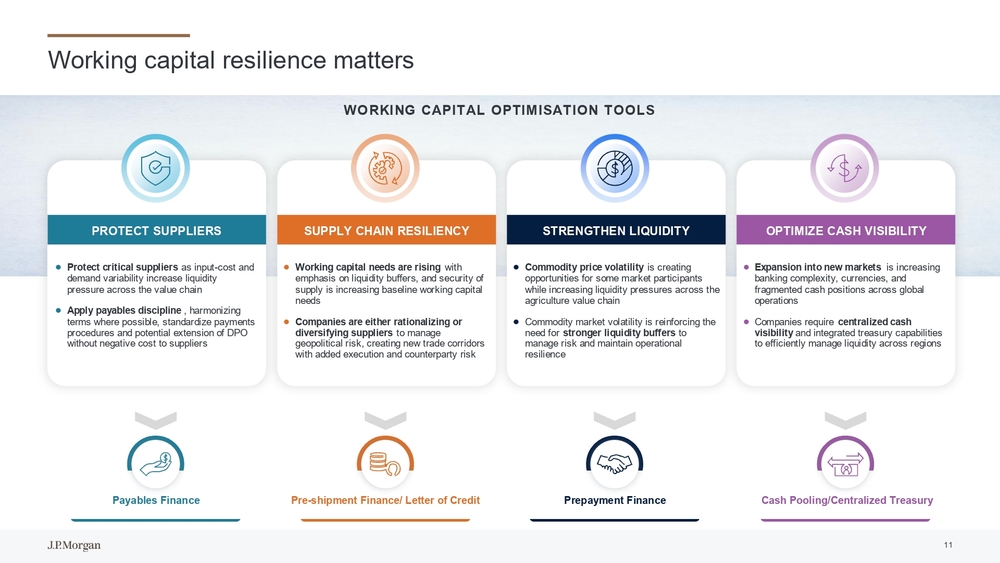
Working capital resilience matters Payables Finance Prepayment Finance Cash Pooling/Centralized Treasury PROTECT SUPPLIERS ⚫Protect critical suppliers as input -cost and demand variability increase liquidity pressure across the value chain ⚫Apply payables discipline , harmonizing terms where possible, standardize payments procedures and potential extension of DPO without negative cost to suppliers SUPPLY CHAIN RESILIENCY ⚫Working capital needs are rising with emphasis on liquidity buffers, and security of supply is increasing baseline working capital needs ⚫Companies are either rationalizing or diversifying suppliers to manage geopolitical risk, creating new trade corridors with added execution and counterparty risk STRENGTHEN LIQUIDITY ⚫Commodity price volatility is creating opportunities for some market participants while increasing liquidity pressures across the agriculture value chain ⚫Commodity market volatility is reinforcing the need for stronger liquidity buffers to manage risk and maintain operational resilience OPTIMIZE CASH VISIBILITY ⚫Expansion into new markets is increasing banking complexity, currencies, and fragmented cash positions across global operations ⚫Companies require centralized cash visibility and integrated treasury capabilities to efficiently manage liquidity across regions Pre-shipment Finance/ Letter of Credit WORKING CAPITAL OPTIMISATION TOOLS 11
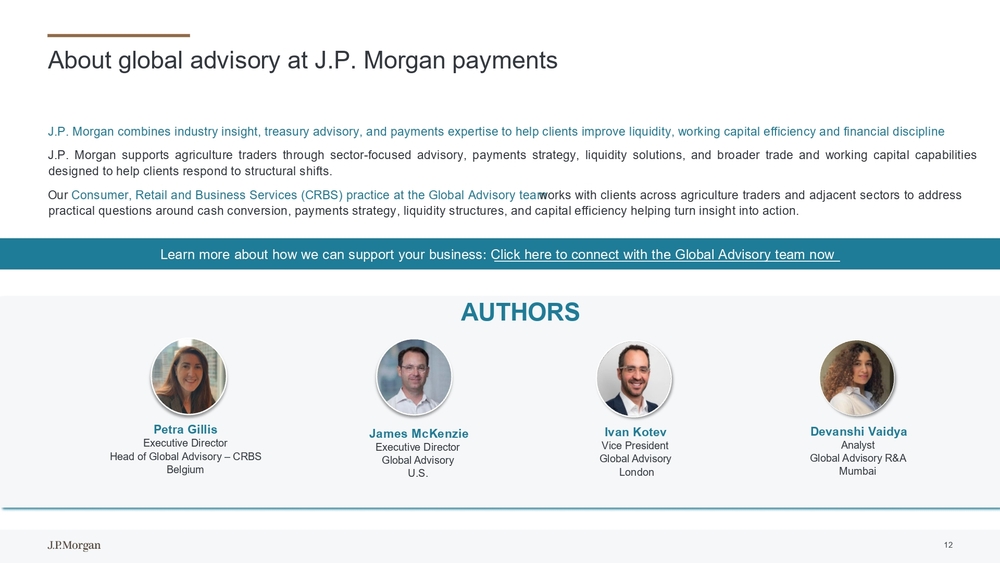
About global advisory at J.P. Morgan payments J.P.Morgan combines industry insight, treasury advisory, andpayments expertise tohelp clients improve liquidity, working capital efficiency andfinancial discipline J.P.Morgan supports agriculture traders through sector -focused advisory, payments strategy, liquidity solutions, and broader trade and working capital capabilities designed tohelp clients respond tostructural shifts . OurConsumer, Retail andBusiness Services (CRBS) practice attheGlobal Advisory team works withclients across agriculture traders andadjacent sectors toaddress practical questions around cash conversion, payments strategy, liquidity structures, andcapital efficiency helping turninsight intoaction . Petra Gillis Executive Director Head of Global Advisory –CRBS BelgiumDevanshi Vaidya Analyst Global Advisory R&A Mumbai Ivan Kotev Vice President Global Advisory London AUTHORS Learn more about how we can support your business: Click here to connect with the Global Advisory team now James McKenzie Executive Director Global Advisory U.S. 12
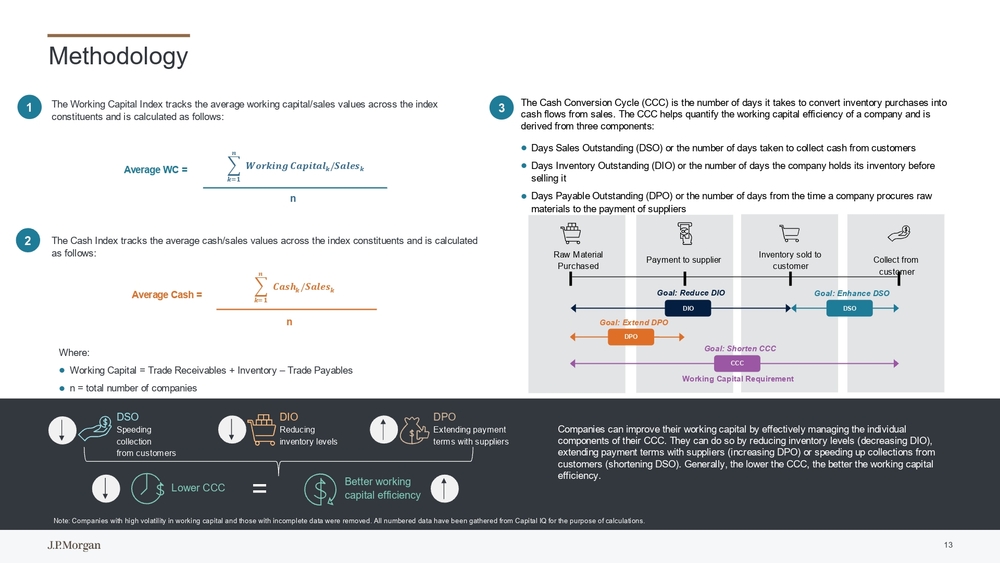
Methodology Where: ⚫Working Capital = Trade Receivables + Inventory –Trade Payables ⚫n = total number of companies n 𝒌=𝟏𝒏 𝑾𝒐𝒓𝒌𝒊𝒏𝒈 𝑪𝒂𝒑𝒊𝒕𝒂𝒍 𝒌/𝑺𝒂𝒍𝒆𝒔𝒌 Average WC = 𝒌=𝟏𝒏 𝑪𝒂𝒔𝒉𝒌/𝑺𝒂𝒍𝒆𝒔𝒌 nAverage Cash = DPODIO DSO CCC Working Capital RequirementRaw Material PurchasedCollect from customer Payment to supplierInventory sold to customer Goal: Extend DPOGoal: Reduce DIO Goal: Enhance DSO Goal: Shorten CCCThe Working Capital Index tracks the average working capital/sales values across the index constituents and is calculated as follows: The Cash Index tracks the average cash/sales values across the index constituents and is calculated as follows: Companies can improve their working capital by effectively managing the individual components of their CCC. They can do so by reducing inventory levels (decreasing DIO), extending payment terms with suppliers (increasing DPO) or speeding up collections from customers (shortening DSO). Generally, the lower the CCC, the better the working capital efficiency. Note: Companies with high volatility in working capital and those with incomplete data were removed. All numbered data have b eengathered from Capital IQ for the purpose of calculations.The Cash Conversion Cycle (CCC) is the number of days it takes to convert inventory purchases into cash flows from sales. The CCC helps quantify the working capital efficiency of a company and is derived from three components: ⚫Days Sales Outstanding (DSO) or the number of days taken to collect cash from customers ⚫Days Inventory Outstanding (DIO) or the number of days the company holds its inventory before selling it ⚫Days Payable Outstanding (DPO) or the number of days from the time a company procures raw materials to the payment of suppliers1 23 DSO Speeding collection from customersDIO Reducing inventory levelsDPO Extending payment terms with suppliers Lower CCCBetter working capital efficiency = 13
Disclaimer This material was prepared exclusively for the benefit and internal use of the JPMorgan client to whom it is directly address ed (including such client’s subsidiaries, the “Company”) in order to assist the Company in evaluating a possible transaction(s) and does not carry any right of disclosure to any other party. In preparing this material, we have relied upon and assumed, without independent verification, the accura cy and completeness of all information available from public sources or which was provided to us by or on behalf of the Company or which was otherwise reviewed by us. This material is for discussion purposes only and is incomplete without reference to the other briefings provided by JPMo rgan. Neither this material nor any of its contents may be disclosed or used for any other purpose without the prior written con sent of JPMorgan. This material is not intended to provide legal, tax, investment, accounting, financial, business, real estate, technology or other advice, and should not be used for or relied upon for these purposes. The views, opinions, estimates and strategies expres sedin this material are those of the respective individual contributors, authors or speakers, and may differ from those of JPMorganChase, or its employees and aff iliates. Any market and/or economic commentary in this material in no way constitutes JPMorganChase research and should not be t reated as such. Further, the views expressed in this content may differ from those contained in JPMorganChase research reports. The content in this materi al has been obtained from sources deemed to be reliable, but JPMorganChase makes no representation or warranty as to its accurac y or completeness. In no event shall JPMorganChase nor any of its directors, officers, employees or agents be liable for any use of, for any decision made or action taken in reliance upon, or for any inaccuracies or errors in or omissions from, this material. J.P.Morgan, JPMorgan, JPMorgan Chase, Chase, Chase Merchant Services, and Chase Payment Solutions are marketing names for certa in businesses of JPMorgan Chase & Co. and its subsidiaries worldwide (collectively, “JPMC”). Products or services may be mark eted and/or provided by commercial banks such as JPMorgan Chase Bank, N.A., securities or other non -banking affiliates or other JPMC entities. JPMC c ontact persons may be employees or officers of any of the foregoing entities and the terms “J.P. Morgan”, “JPMorgan”, “JPMorgan Chase”, “Chase”, “Chase Merchant Services” and “Chase Payment Solutions” if and as used herein include as applicable all such employees or officers a nd/or entities irrespective of marketing name(s) used. Nothing in this material is a solicitation by JPMC of any product or serv icewhich would be unlawful under applicable laws or regulations. Investments or strategies discussed herein may not be suitable for all investors. Neither JPMorgan nor any of its directors, officers, employees or agents shall incur in any responsibility or liability whatsoever to the Company or any other party with r espect to the contents of any matters referred herein, or discussed as a result of , this material. This material is not intended to provide, and should not be relied on for, accounting, legal or tax advice o r investment recommendations. Please consult your own tax, legal, accounting or investment advisor concerning such matters. Not all products and services are available in all geographic areas. Eligibility for particular products and services is subject to final determination by JPMC and or its affiliates. This material does not constitute a commitment byany JPMC entity to extend or arrange credit or to provide any other products or services and JPMorgan reserves the right to withdraw at any time. All products and services are subject to applicable laws, regulations, and applicable approvals and notifications. The Company should examine the specific restrictions a nd limitations under the laws of its own jurisdiction that may be applicable to the Company due to its nature or to the products and services referred herein. Any mentions of third -party trademarks, brand names, products and services are for referential purposes only and any mention the reof is not meant to imply any sponsorship, endorsement, or affiliation. Notwithstanding anything to the contrary, the statements in this material are not intended to be legally binding. Any product s, services, terms or other matters described herein (other than in respect of confidentiality) are subject to, and superseded b y, the terms of separate legally binding documentation and/or are subject to change without notice. Changes to Interbank Offered Rates (IBORs) and other benchmark rates: Certain interest rate benchmarks are, or may in the fut urebecome, subject to ongoing international, national and other regulatory guidance, reform and proposals for reform. For more i nformation, please consult: https://www.jpmorgan.com/global/disclosures/interbank_offered_rates . JPMorgan Chase Bank, N.A. Member FDIC. Deposits held in non -U.S. branches are not FDIC insured. Non -deposit products are not FDI C insured. JPMorgan Chase Bank, N.A., organized under the laws of U.S.A. with limited liability. © 2026 JPMorgan Chase & Co. All Rights Reserved. 17