JPMC_CfG_Energy Sept 2026_V6
by JPMorgan
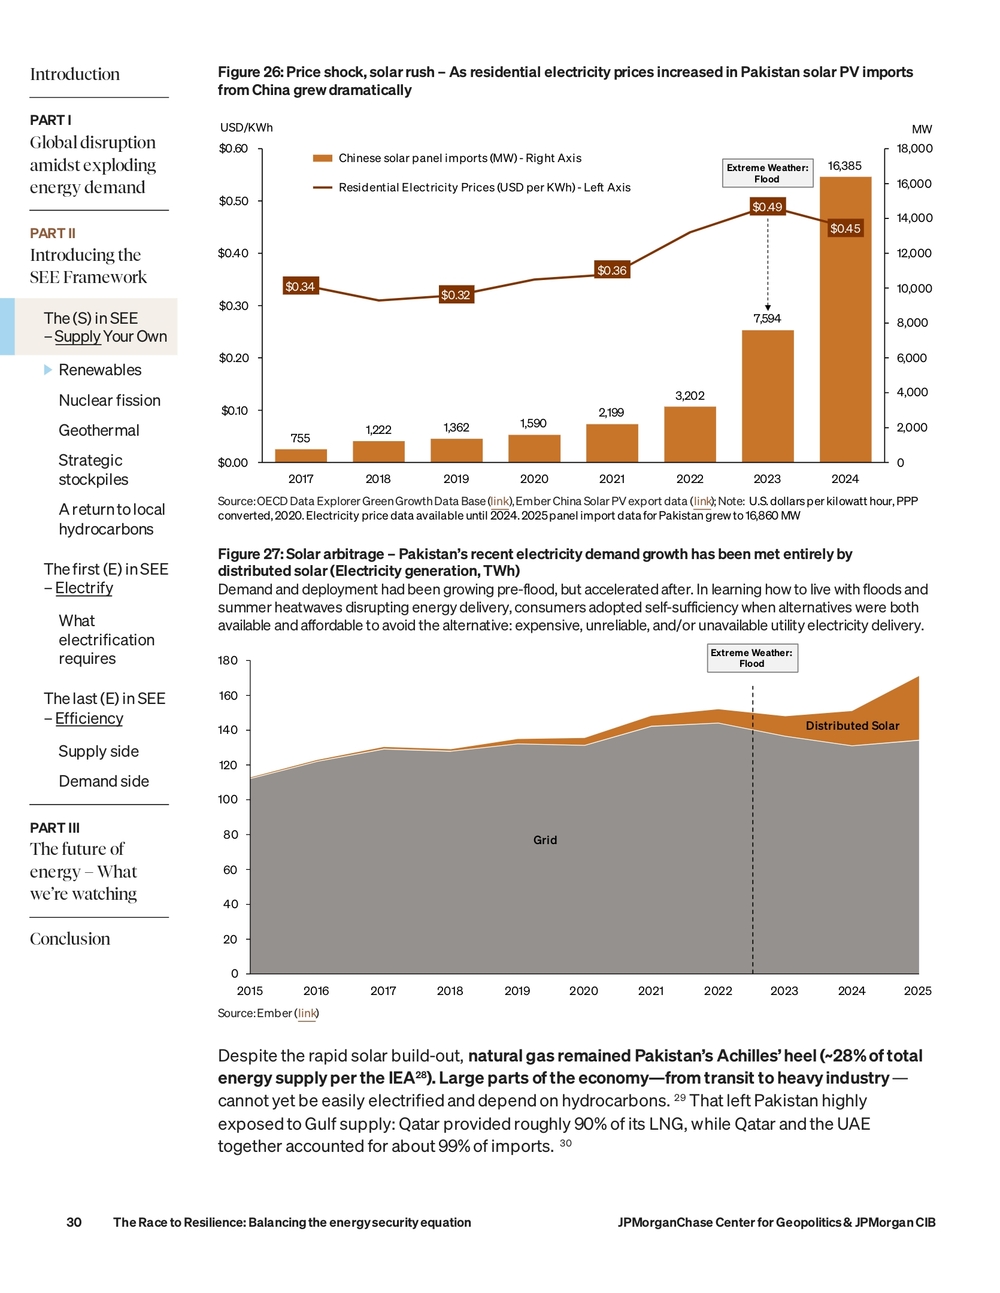
JPMorganChase Center for Geopolitics & JPMorgan CIB The Race to Resilience: Balancing the energy security equation1The Race to Resilience: Balancing the energy security equationSeptember 2026 Center for Geopolitics Derek Chollet Managing Director and Head of the JPMorganChase Center for GeopoliticsJ.P. Morgan Commercial and Investment Bank Dr Sarah Kapnick Global Head of Climate Advisory
The Race to Resilience: Balancing the energy security equation JPMorganChase Center for Geopolitics & JPMorgan CIB2Table of Contents Introduction—From generation to resilience 4 Part I—Global disruption amidst exploding energy demand 7 Dimensions of energy security and resilience 7 Global energy disruption 11 Pay up or cut down: Supply vs cost strategies 12 Detours: Infrastructure workarounds to the Strait of Hormuz 15 Hardening infrastructure against physical and cyber vulnerabilities 17 Three national models of energy resilience during the Iran war 18 China: Resilience through reserves, electrification, and fuel switching 19 U.S.: Resilience through domestic production and strong hemispheric supply chains 22 Norway: Resilience derived through domestic renewable resources (hydropower) and EVs 25 Part II—How to build energy resilience: Introducing the SEE Framework 27 The (S) in SEE – Supply Your Own 28 Renewables—and the solar surge 29 Nuclear fission 31 Geothermal 38 Strategic stockpiles 40 A return to local hydrocarbons – including coal 42 The First (E) in SEE – Electrify 45 What electrification requires 46 The last (E) in SEE – Efficiency 51 Supply side 51 Demand side 54 Part III— The future of energy: What we’re watching 56 Spotlight #1: The rise of non-Gulf LNG and oil hubs: Mozambique, Alaska, Venezuela 56 Spotlight #2: Is this the decade fusion energy commercializes? 58 Spotlight #3: Long-duration storage 61 Conclusion 64 Endnotes 66 About the JPMorganChase Center for Geopolitics and J.P. Morgan Climate Advisory 70 About the authors 70 Disclaimers 71
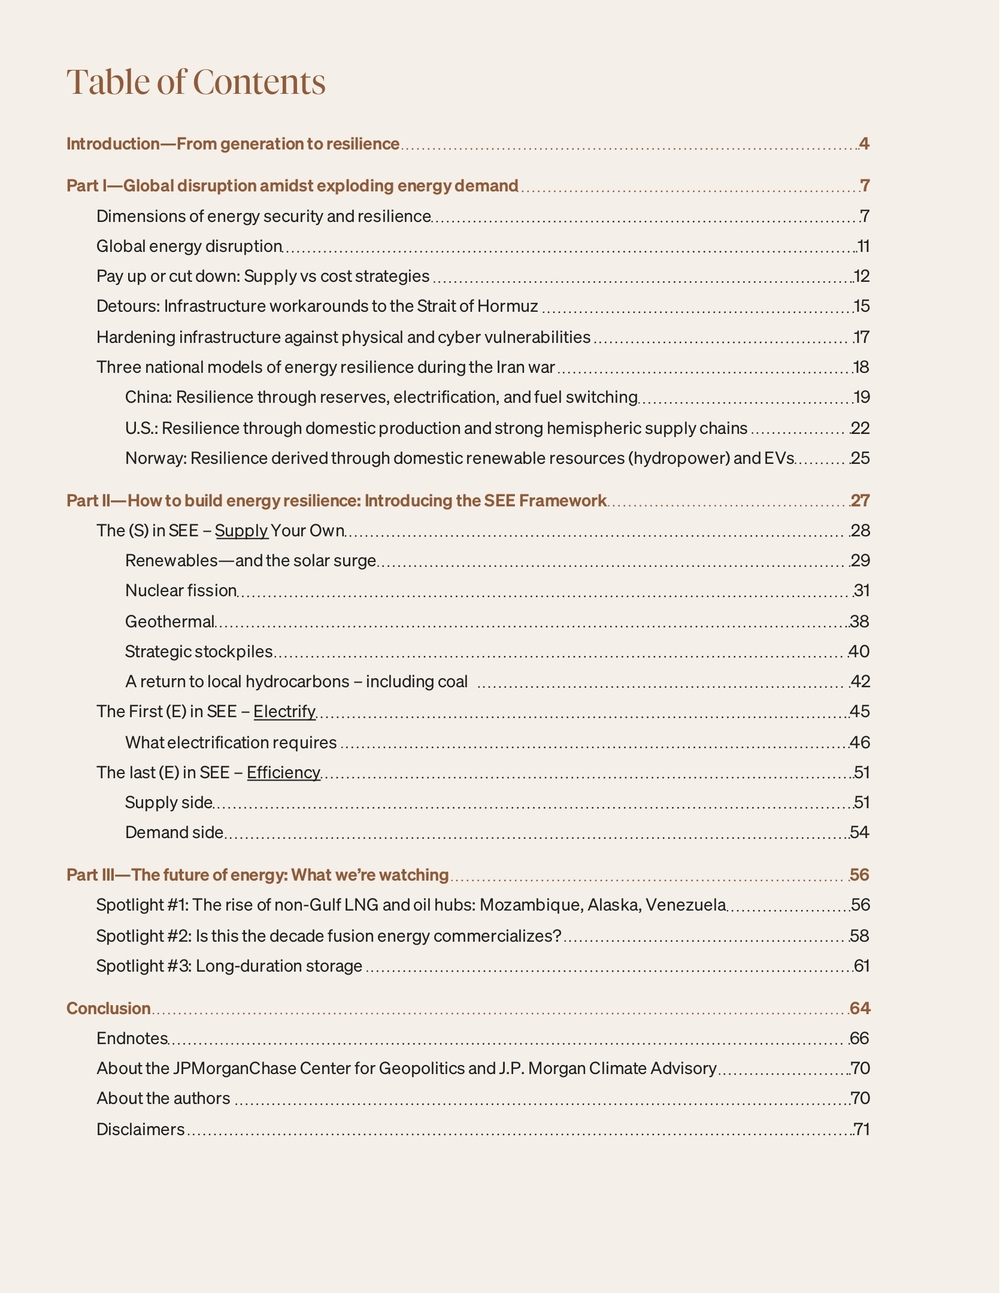
JPMorganChase Center for Geopolitics & JPMorgan CIB The Race to Resilience: Balancing the energy security equation3Key takeaways: → Energy competition is shifting from “who can produce the most” to “who can keep energy flowing under stress.” Since our 2025 report, the core challenge has compounded: resilience is now the differentiator, not sheer supply. This report frames the new contest as the race to resilience . → The next energy order will belong to flexible systems builders. Competitive advantage will come from assembling—and sustaining—full stacks: supply, grids, storage, software modernization, infrastructure, and supply chains that can keep energy flowing under stress for years to come. → Geopolitical shocks won’t hit evenly—and resilience is increasingly about optionality. The 2026 Iran war underscored that countries with strategic reserves, alternative transit routes, diversified suppliers, and flexible power systems absorbed disruption far better than those without those options. → Resilience isn’t only about handling immediate impacts—recovering quickly to be prepared for the next disruption is critical . Successfully mitigating a price or physical supply shock in the short term often simply shifts risk exposure to the future. Systems that can quickly recalibrate are more resilient to repeated volatility. In the long term, decisions made today to invest in frontier technology, execute infrastructure builds efficiently, and build workforce development will become decisive advantages to keep energy flowing under sustained energy demand growth. → Electrification is essential to the resilience story, but timing and delivery matter. The challenge isn’t just generating more power; it’s generating it when needed, moving it where required, and storing it for long durations—reliably and at scale. → We distill these lessons into a practical roadmap: the “SEE Framework”—Supply Y our Own, Electrify, and Enhance Efficiency. T ogether, these three pillars reduce exposure to volatility while improving reliability and illustrate what investments can be made now to build more resilient energy systems in the 2030s and beyond. Local energy sources.Supply Your Own Electrify key consumer, AI, and industry users.Electrify Efficiency Make grid and end-user consumption more energy efficient so electrons do more for less. Source: JPMorganChase
Introduction PART I Global disruption amidst exploding energy demand PART II Introducing the SEE Framework PART III The future of energy – What we’re watching Conclusion The Race to Resilience: Balancing the energy security equation JPMorganChase Center for Geopolitics & JPMorgan CIB 4Introduction From generation to resilience The energy race is no longer only about who can generate the most molecules or electrons— it’s about who can keep energy flowing when systems come under stress. This report explains that shift, and why resilience—not supply alone—is now the defining measure of energy security. In our 2025 energy report, Power Rewired , we argued that in an electrifying world, national power would increasingly accrue to those able to produce abundant and reliable energy. We also argued that while policy and capital matter, energy systems remain shaped by the harder realities of geography, geology, and meteorology.1 Since then, the conversation has widened from generation to resilience. The war with Iran, repeated attacks on energy infrastructure, a growing push to localize energy systems, and extreme weather have made the core question more operational: who can keep energy flowing when systems come under stress—from conflict, climate impacts, or other disruptions . A recent Atlantic Council survey of more than 1,000 energy experts from 97 countries underscores this pivot: more than half of respondents rank geopolitical conflict as the most consequential factor shaping the global energy system today and in the future. Looking to 2030, they identify insufficient investment in infrastructure as the second largest risk— suggesting today’s investment choices will enable, or constrain, tomorrow’s resilience. (Figure 1).2
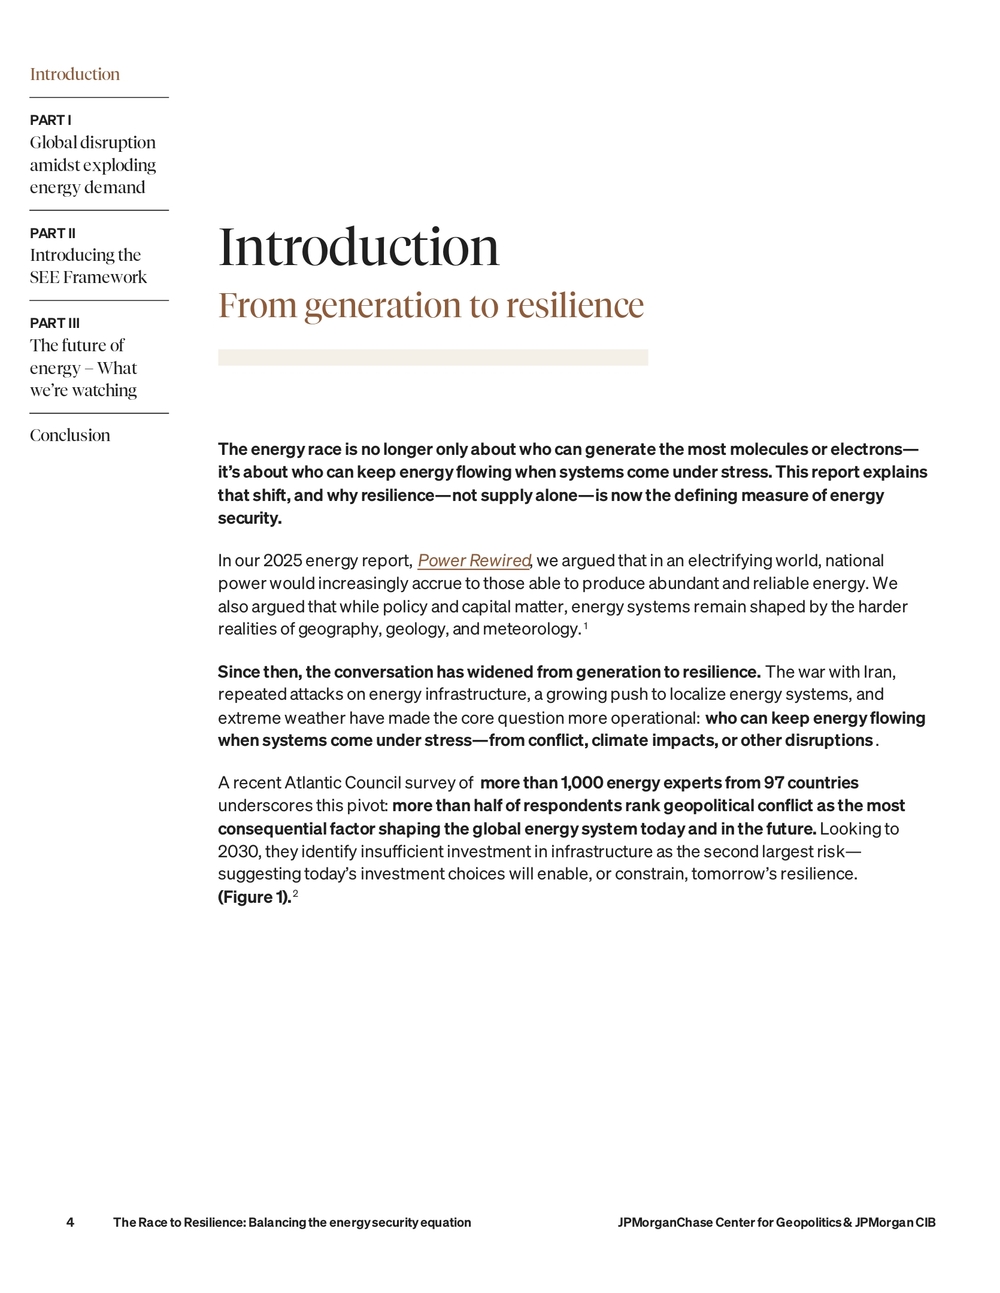
JPMorganChase Center for Geopolitics & JPMorgan CIB The Race to Resilience: Balancing the energy security equation5Figure 1: Geopolitical conflict had the greatest impact on the global energy system in 2025, a state of affairs expected to remain in 2030 0% 10% 20% 30% 40% 50% 60% Geopolitical conflict National energy policy National trade and economic policy Technological innovation Flow of capital Other 0% 10% 20% 30% 40% 50% 60% Geopolitical conflict Insufficient investment in energy infrastructure Trade tensions and protectionism Volatility in global oil and gas markets Other Insufficient investment in technology Question: in 2025, which of the following factors had the greatest impact on the global energy system?Question: Looking ahead to 2030, which factor will pose the biggest risk to the global energy system?2025 2030 Source: Atlantic Council, 2026 Global Energy Agenda survey results ( link) Those findings motivate this year’s framework. We focus on two questions: how geopolitical risk is changing where energy is produced and shipped, and what investments are needed now to build more resilient energy systems in the 2030s and beyond. While a historical view can help ground these questions in data, policymakers, scientists, executives and investors cannot assume that the future will automatically resemble the past. Forward-looking analysis must account for potential step-changes or non-linear shifts that could change the rules of the game. Our central finding is straightforward: supply is necessary, but it is not sufficient. Alternative trade routes, flexible power networks, and strategic reserves can be just as important as electrons and molecules themselves. And new technologies and evolving physical risks may fundamentally change the calculus around resilience. In practice, energy security is a balancing act among affordability, reliability, and long-term resilience. Different pathways carry different trade-offs. → Producing more energy at home can reduce dependence on foreign suppliers once infrastructure is operational, but it can be expensive to start, slow to build, and dependent on imported equipment and critical minerals to develop. → Imported hydrocarbons can be cheaper in the near term but they come with strategic risk, as demonstrated by the Iran war. Disruptions tied to the Strait of Hormuz quickly translated into higher prices and supply dislocations. → Electrification has both push-and-pull dynamics . AI data centers, electric vehicles, and industrial electrification all increase the need for abundant power—supporting the financial case for new generation, grid modernization, and clean firm domestic supply. Yet those same trends also add pressure to already strained grids, fuel inputs, and prices if grid infrastructure development cannot keep pace.
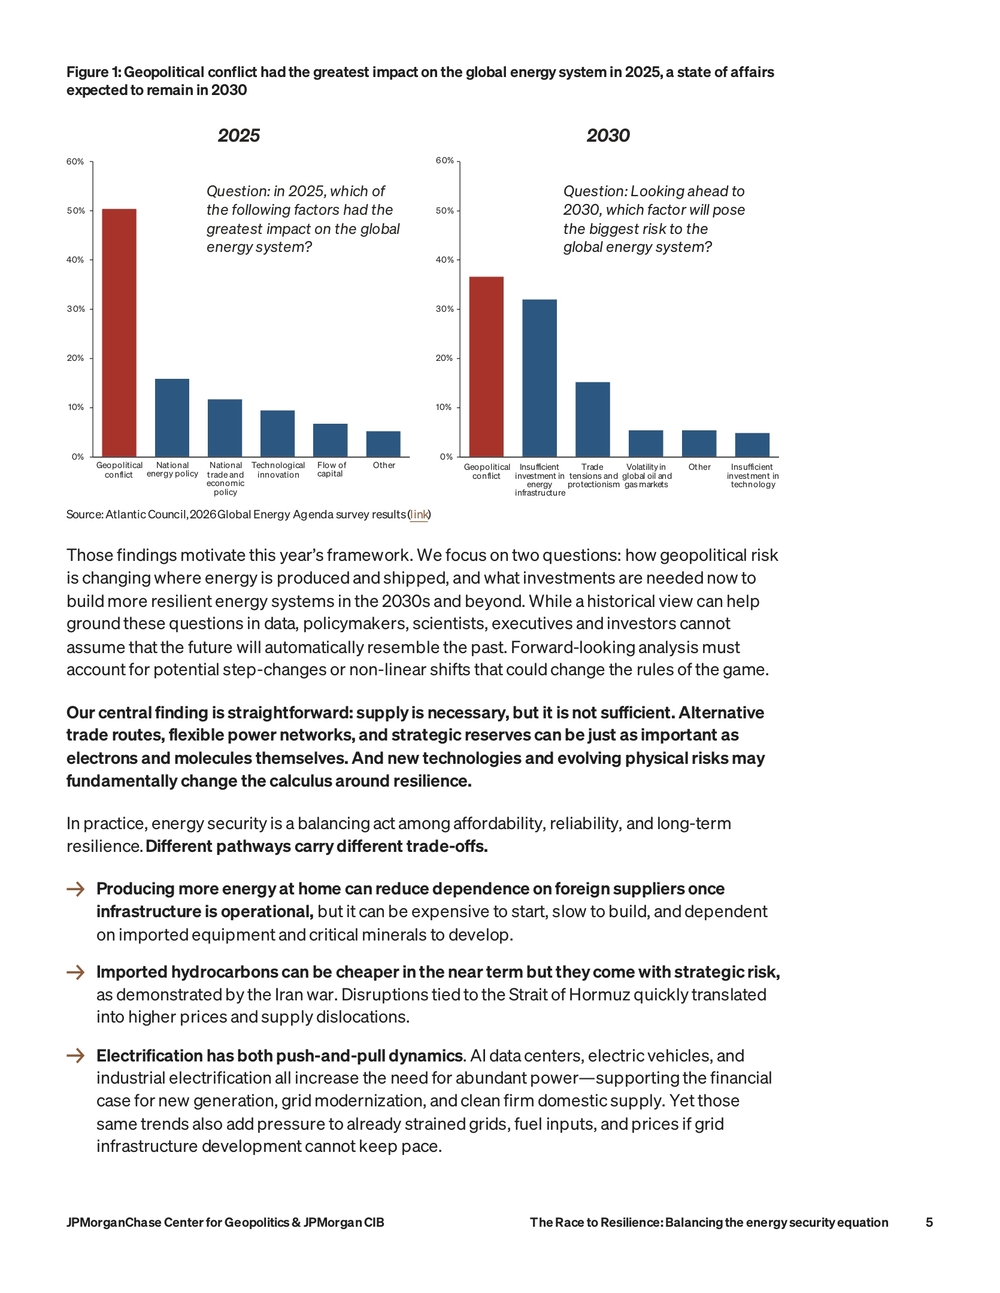
Introduction PART I Global disruption amidst exploding energy demand PART II Introducing the SEE Framework PART III The future of energy – What we’re watching Conclusion The Race to Resilience: Balancing the energy security equation JPMorganChase Center for Geopolitics & JPMorgan CIB 6Figure 2: Energy security is a constant balancing act Source: JPMorganChase We have organized this year’s report into three parts : • Part I explores the dimensions of energy resilience and looks back at one of the most momentous years in energy security in a generation. We trace the consequences of the Iran war for global supply—where shocks concentrated, where they dispersed, and why. We compare different models of response, from market-based adjustment to state-led intervention, and we map the trends that accelerated in its wake: diversification of suppliers, fortification of critical nodes, and the return of strategic supply as a core instrument of national policy. • Part II then moves from diagnosis to framework, introducing our “ SEE Framework” for energy resilience: (1) Supply Y our Own, (2) Electrify, and (3) Enhance Efficiency. We apply this framework to assess how countries are racing to resilience: which trade-offs they are making, which vulnerabilities they are reducing, and where the resilience equation still does not balance. • Finally, Part III looks ahead. We assess the technologies and trends that will shape the next phase of resilience—what is changing in supply and storage, what is shifting in transmission and distribution, and how innovation is redefining the frontier of what “secure, reliable energy” can realistically mean.
JPMorganChase Center for Geopolitics & JPMorgan CIB The Race to Resilience: Balancing the energy security equation7Part I Global disruption amidst exploding energy demand Dimensions of energy security and resilience Before diving into the specifics of the Iran war, it is helpful to articulate how we view energy resilience conceptually. Because energy resilience has many moving, interconnected parts— and different shocks stress different parts of the system—there is no simple 10-point scale for energy security. Instead, we present a set of indicators across key dimensions to show where countries appear relatively resilient (or exposed) right now . The indicators reflect priorities that vary across time and place, shaped by trade relationships, geography, technology choices, and geopolitical tensions—so they are best read as a comparative snapshot, not a definitive ranking.
Introduction PART I Global disruption amidst exploding energy demand Dimensions of energy security and resilience Global energy disruption Supply vs cost strategies Infrastructure workarounds to the Strait of Hormuz Hardening critical infrastructure and the impact of asymmetric costs Three national models of energy resilience China U.S. Norway PART II Introducing the SEE Framework PART III The future of energy – What we’re watching Conclusion The Race to Resilience: Balancing the energy security equation JPMorganChase Center for Geopolitics & JPMorgan CIB 8Key dimensions of energy security and resilience
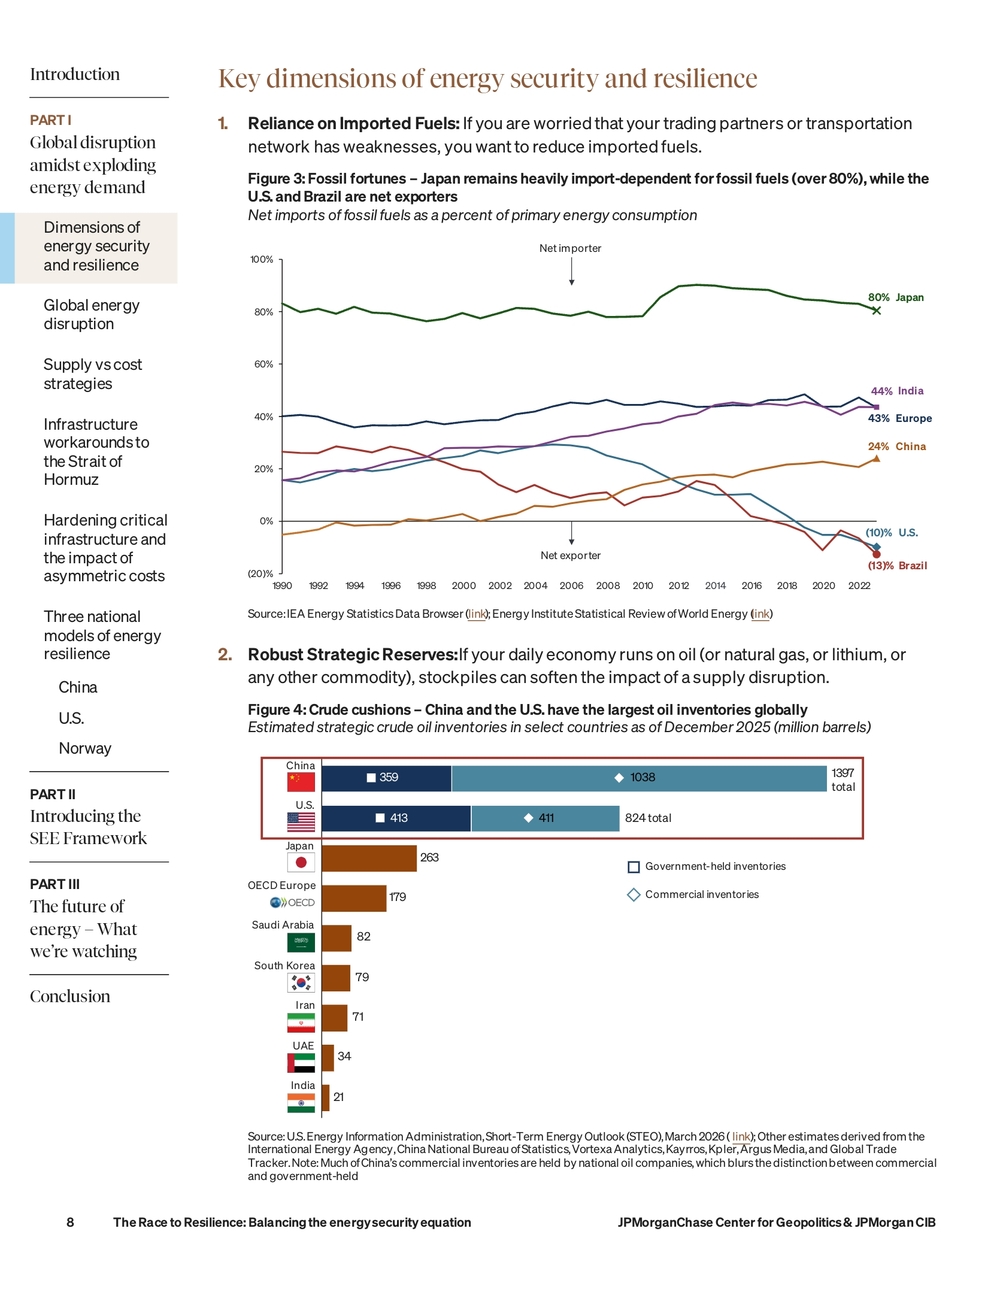
- Reliance on Imported Fuels: If you are worried that your trading partners or transportation network has weaknesses, you want to reduce imported fuels. Figure 3: Fossil fortunes – Japan remains heavily import-dependent for fossil fuels (over 80%), while the U.S. and Brazil are net exporters Net imports of fossil fuels as a percent of primary energy consumption (10)% (13)% 24% 43% 44% 80% (20)% 0% 20% 40% 60% 80% 100% 1990 1992 1994 1996 1998 2000 2002 2004 2006 2008 2010 2012 2014 2016 2018 2020 2022 Net exporter Net importer Japan Europe India China U.S. Brazil Source: IEA Energy Statistics Data Browser ( link); Energy Institute Statistical Review of World Energy ( link)
- Robust Strategic Reserves: If your daily economy runs on oil (or natural gas, or lithium, or any other commodity), stockpiles can soften the impact of a supply disruption. Figure 4: Crude cushions – China and the U.S. have the largest oil inventories globally Estimated strategic crude oil inventories in select countries as of December 2025 (million barrels) 1397 total 824 total 263 179 82 79 71 34 21 359 413 1038 411 China U.S. Japan OECD Europe Saudi Arabia South Korea Iran UAE India Government-held inventories Commercial inventories Source: U.S. Energy Information Administration, Short-T erm Energy Outlook (STEO), March 2026 ( link); Other estimates derived from the International Energy Agency, China National Bureau of Statistics, Vortexa Analytics, Kayrros, Kpler, Argus Media, and Global Trade Tracker. Note: Much of China’s commercial inventories are held by national oil companies, which blurs the distinction between commercial and government-held
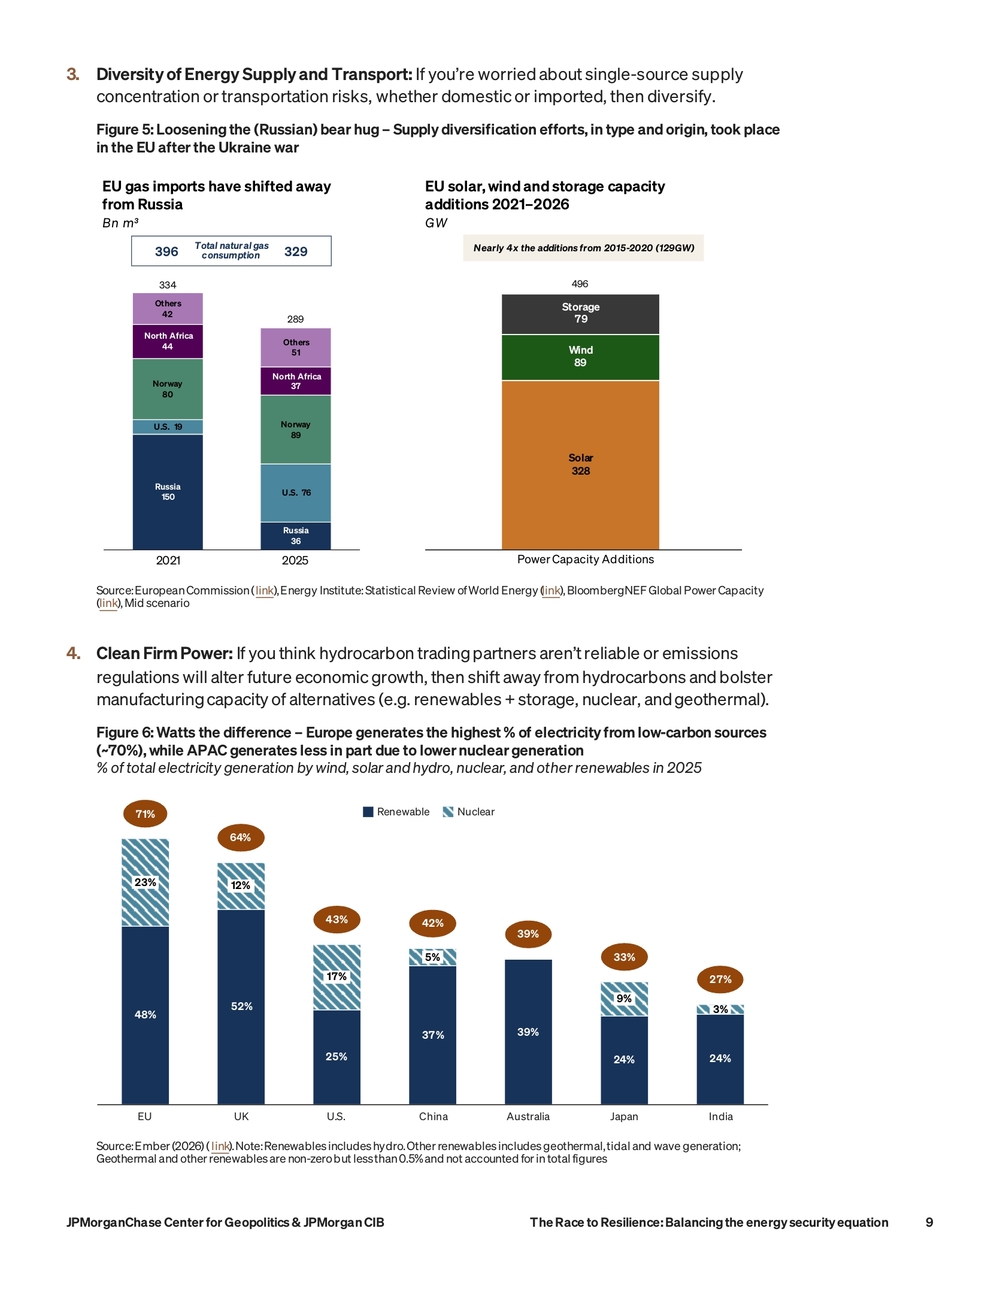
JPMorganChase Center for Geopolitics & JPMorgan CIB The Race to Resilience: Balancing the energy security equation93. Diversity of Energy Supply and Transport: If you’re worried about single-source supply concentration or transportation risks, whether domestic or imported, then diversify. Figure 5: Loosening the (Russian) bear hug – Supply diversification efforts, in type and origin, took place in the EU after the Ukraine war Russia 150 Russia 36 U.S. 19 U.S. 76 Norway 80 Norway 89 North Africa 44 North Africa 37 Others 42 Others 51 334 289 2021 2025 EU gas imports have shifted away from Russia Total natural gas consumption 396 329EU solar, wind and storage capacity additions 2021–2026 Nearly 4x the additions from 2015-2020 (129GW) 496 Solar 328 Wind 89 Storage 79 Power Capacity AdditionsBn m³ GW Source: European Commission ( link), Energy Institute: Statistical Review of World Energy ( link), BloombergNEF Global Power Capacity (link), Mid scenario 4. Clean Firm Power: If you think hydrocarbon trading partners aren’t reliable or emissions regulations will alter future economic growth, then shift away from hydrocarbons and bolster manufacturing capacity of alternatives (e.g. renewables + storage, nuclear, and geothermal). Figure 6: Watts the difference – Europe generates the highest % of electricity from low-carbon sources (~70%), while APAC generates less in part due to lower nuclear generation % of total electricity generation by wind, solar and hydro, nuclear, and other renewables in 2025 48% 52% 25% 37% 39% 24% 24% 23% 12% 17% 5% 3% EU UK U.S. China Australia Japan India 71% 64% 43% 42% 39% 33% 27% Renewable Nuclear 9% Source: Ember (2026) ( link). Note: Renewables includes hydro. Other renewables includes geothermal, tidal and wave generation; Geothermal and other renewables are non-zero but less than 0.5% and not accounted for in total figures
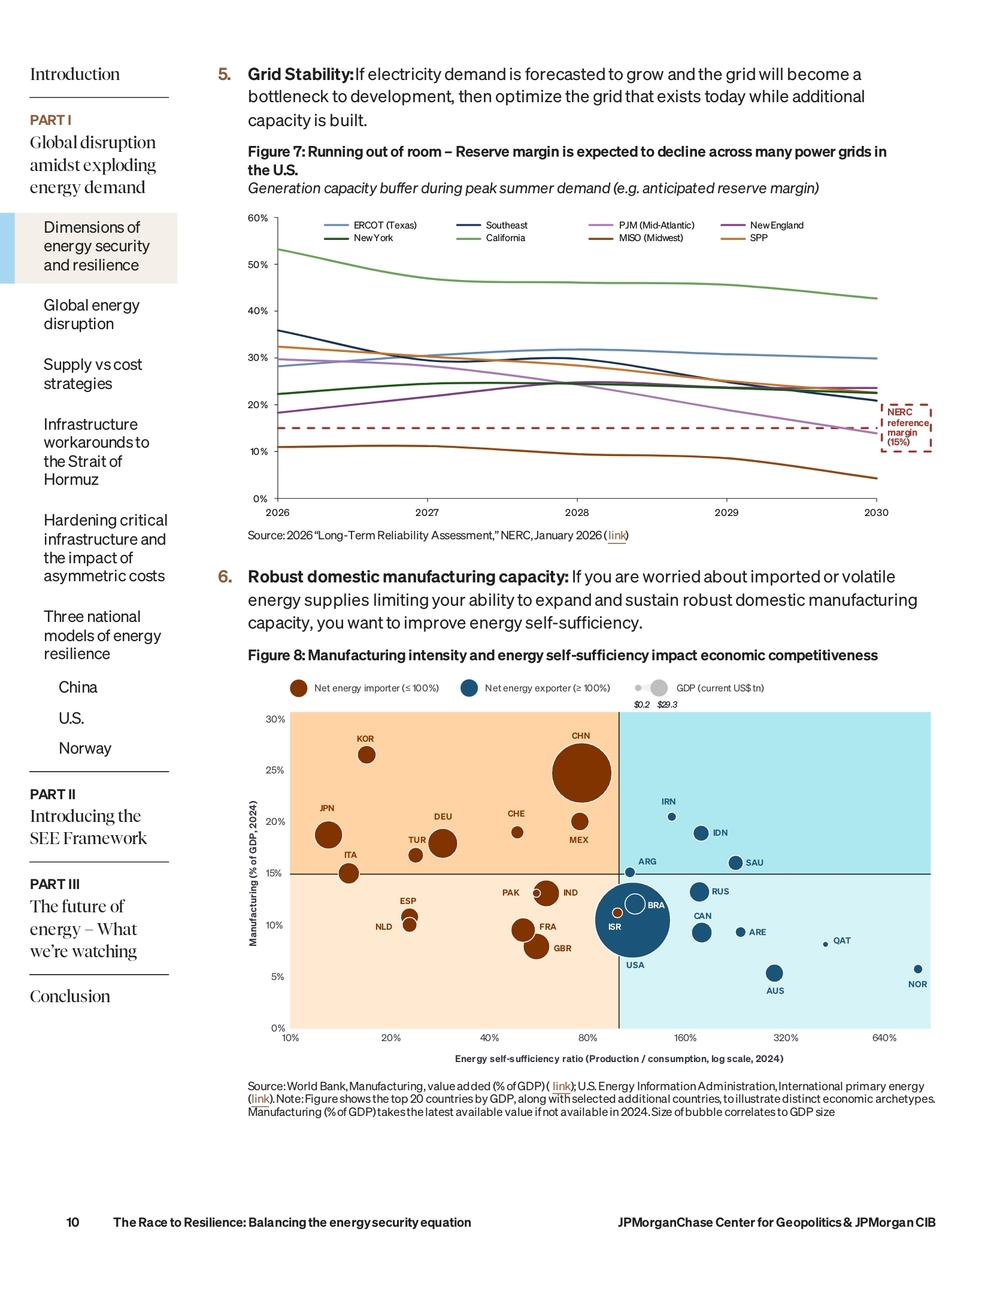
Introduction PART I Global disruption amidst exploding energy demand Dimensions of energy security and resilience Global energy disruption Supply vs cost strategies Infrastructure workarounds to the Strait of Hormuz Hardening critical infrastructure and the impact of asymmetric costs Three national models of energy resilience China U.S. Norway PART II Introducing the SEE Framework PART III The future of energy – What we’re watching Conclusion The Race to Resilience: Balancing the energy security equation JPMorganChase Center for Geopolitics & JPMorgan CIB 105. Grid Stability: If electricity demand is forecasted to grow and the grid will become a bottleneck to development, then optimize the grid that exists today while additional capacity is built. Figure 7: Running out of room – Reserve margin is expected to decline across many power grids in the U.S. Generation capacity buffer during peak summer demand (e.g. anticipated reserve margin) NERC reference margin (15%) 0% 10% 20% 30% 40% 50% 60% 2026 2027 2028 2029 2030 ERCOT (Texas) Southeast PJM (Mid-Atlantic) New England New York California MISO (Midwest) SPP Source: 2026 “Long-T erm Reliability Assessment,” NERC, January 2026 ( link) 6. Robust domestic manufacturing capacity: If you are worried about imported or volatile energy supplies limiting your ability to expand and sustain robust domestic manufacturing capacity, you want to improve energy self-sufficiency. Figure 8: Manufacturing intensity and energy self-sufficiency impact economic competitiveness USA NOR AUS ARE SAU CAN IDN RUS IRN BRA ARG QAT ISR CHN MEX IND GBR PAK FRA CHE DEU TUR ESP NLD KOR ITA JPN 0% 5% 10% 15% 20% 25% 30% 10% 20% 40% 80% 160% 320% 640% Energy self-sufficiency ratio (Production / consumption, log scale, 2024) Manufacturing (% of GDP, 2024) Net energy importer (≤ 100%) Net energy exporter (≥ 100%)GDP (current US$ tn) $0.2 $29.3 Source: World Bank, Manufacturing, value added (% of GDP) ( link); U.S. Energy Information Administration, International primary energy (link). Note: Figure shows the top 20 countries by GDP, along with selected additional countries, to illustrate distinct economic archetypes. Manufacturing (% of GDP) takes the latest available value if not available in 2024. Size of bubble correlates to GDP size
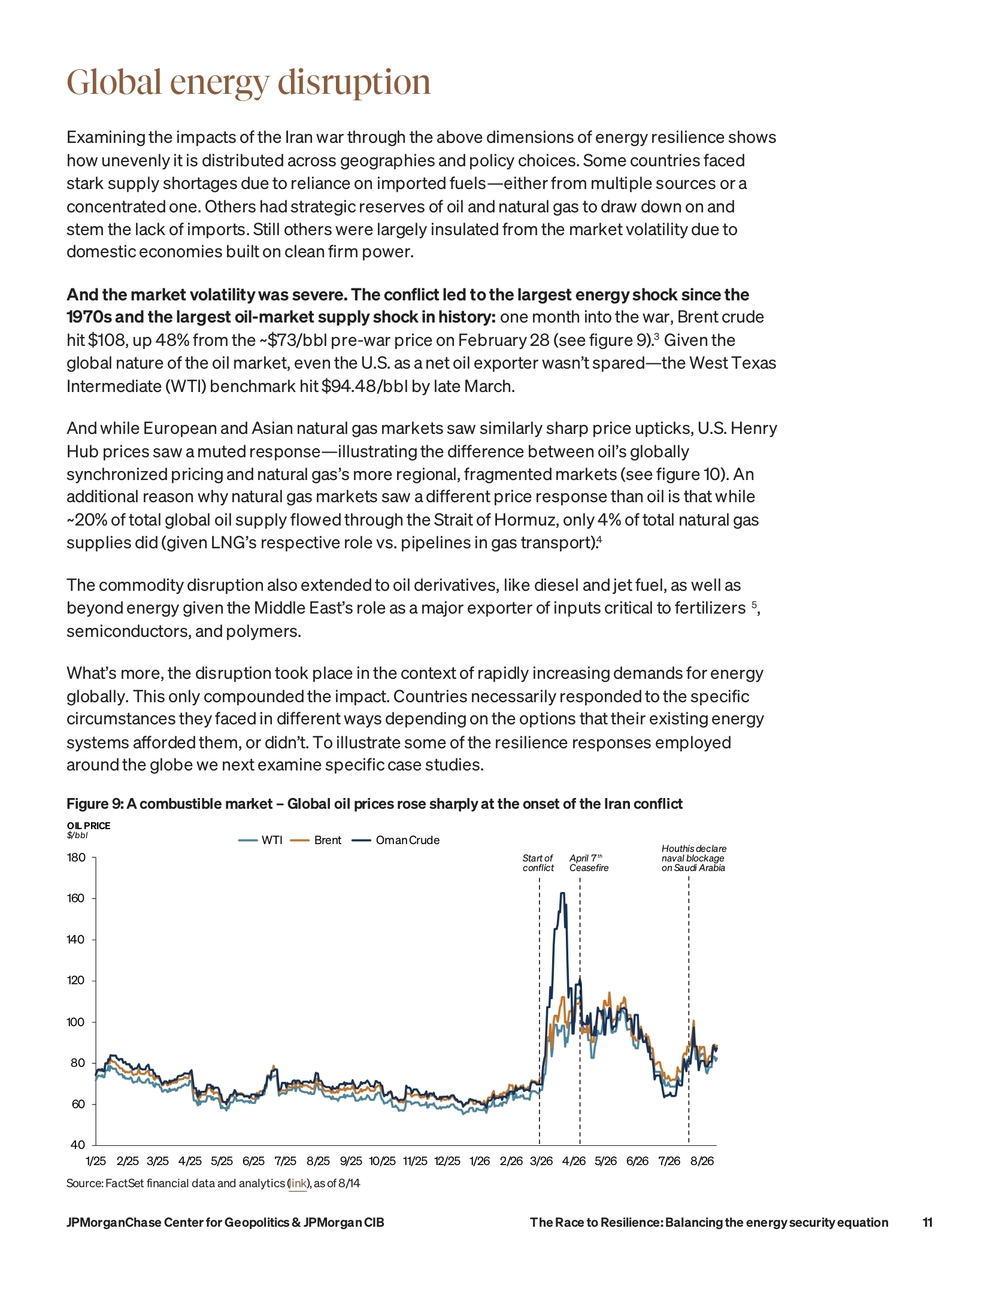
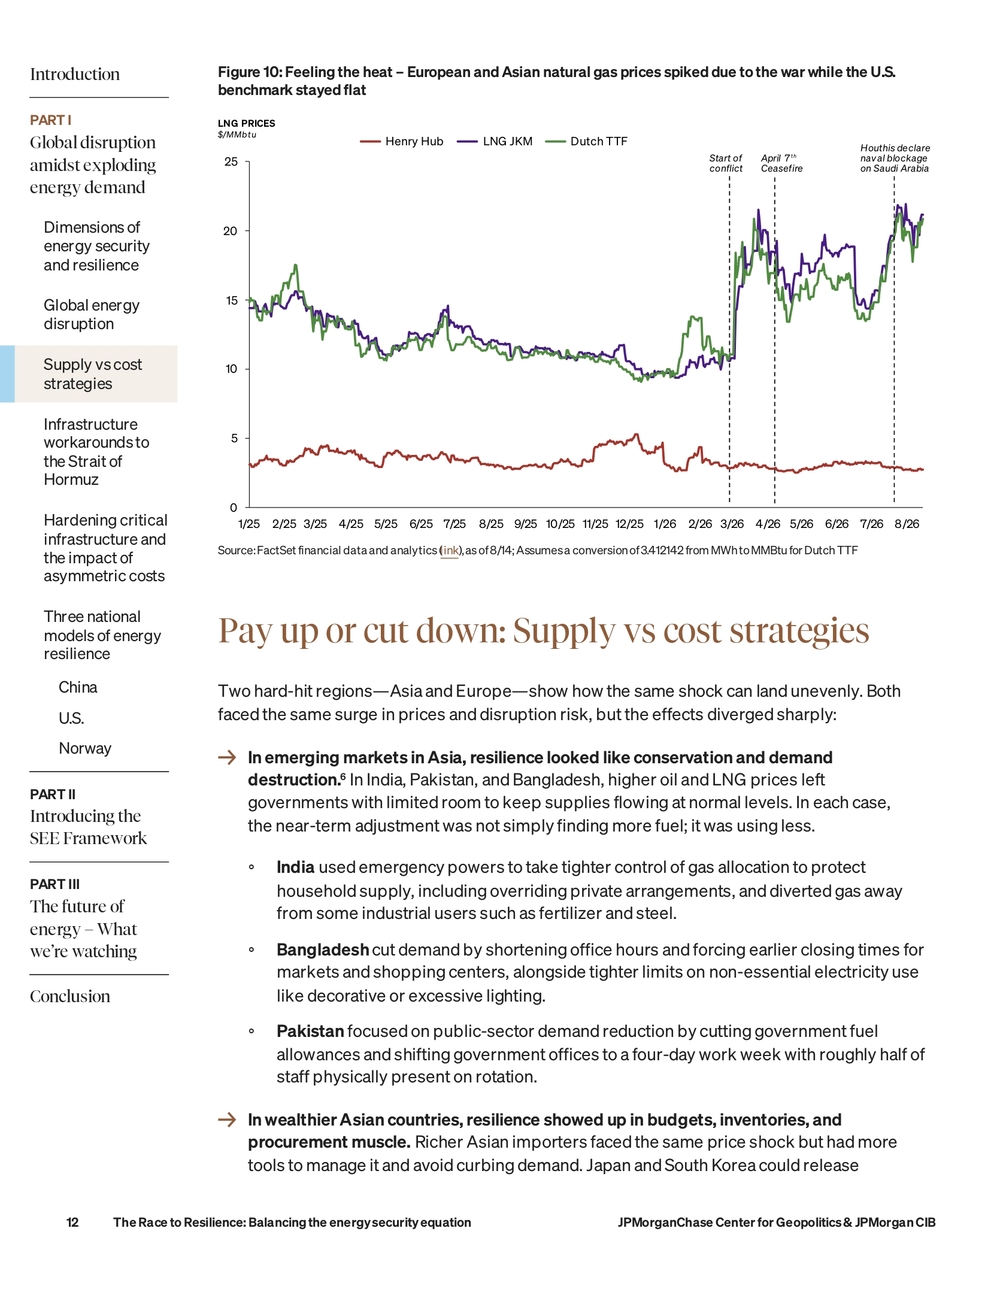
JPMorganChase Center for Geopolitics & JPMorgan CIB The Race to Resilience: Balancing the energy security equation11Global energy disruption Examining the impacts of the Iran war through the above dimensions of energy resilience shows how unevenly it is distributed across geographies and policy choices. Some countries faced stark supply shortages due to reliance on imported fuels—either from multiple sources or a concentrated one. Others had strategic reserves of oil and natural gas to draw down on and stem the lack of imports. Still others were largely insulated from the market volatility due to domestic economies built on clean firm power. And the market volatility was severe. The conflict led to the largest energy shock since the 1970s and the largest oil-market supply shock in history: one month into the war, Brent crude hit $108, up 48% from the ~$73/bbl pre-war price on February 28 (see figure 9).3 Given the global nature of the oil market, even the U.S. as a net oil exporter wasn’t spared—the West T exas Intermediate (WTI) benchmark hit $94.48/bbl by late March. And while European and Asian natural gas markets saw similarly sharp price upticks, U.S. Henry Hub prices saw a muted response—illustrating the difference between oil’s globally synchronized pricing and natural gas’s more regional, fragmented markets (see figure 10). An additional reason why natural gas markets saw a different price response than oil is that while ~20% of total global oil supply flowed through the Strait of Hormuz, only 4% of total natural gas supplies did (given LNG’s respective role vs. pipelines in gas transport).4 The commodity disruption also extended to oil derivatives, like diesel and jet fuel, as well as beyond energy given the Middle East’s role as a major exporter of inputs critical to fertilizers5, semiconductors, and polymers. What’s more, the disruption took place in the context of rapidly increasing demands for energy globally. This only compounded the impact. Countries necessarily responded to the specific circumstances they faced in different ways depending on the options that their existing energy systems afforded them, or didn’t. T o illustrate some of the resilience responses employed around the globe we next examine specific case studies. Figure 9: A combustible market – Global oil prices rose sharply at the onset of the Iran conflict 40 60 80 100 120 140 160 180 1/25 2/25 3/25 4/25 5/25 6/25 7/25 8/25 9/25 10/25 11/25 12/25 1/26 2/26 3/26 4/26 5/26 6/26 7/26 8/26 WTI Brent Oman Crude Start of conflict April 7 th Ceasefire OIL PRICE $/ bbl Houthis declare naval blockage on Saudi Arabia Source: FactSet financial data and analytics ( link), as of 8/14
Introduction PART I Global disruption amidst exploding energy demand Dimensions of energy security and resilience Global energy disruption Supply vs cost strategies Infrastructure workarounds to the Strait of Hormuz Hardening critical infrastructure and the impact of asymmetric costs Three national models of energy resilience China U.S. Norway PART II Introducing the SEE Framework PART III The future of energy – What we’re watching Conclusion The Race to Resilience: Balancing the energy security equation JPMorganChase Center for Geopolitics & JPMorgan CIB 12Figure 10: Feeling the heat – European and Asian natural gas prices spiked due to the war while the U.S. benchmark stayed flat 0 5 10 15 20 25 1/25 2/25 3/25 4/25 5/25 6/25 7/25 8/25 9/25 10/25 11/25 12/25 1/26 2/26 3/26 4/26 5/26 6/26 7/26 8/26 Henry Hub LNG JKM Dutch TTF $/ MMbtu LNG PRICES Start of conflict April 7 th Ceasefire Houthis declare naval blockage on Saudi Arabia Source: FactSet financial data and analytics ( link), as of 8/14; Assumes a conversion of 3.412142 from MWh to MMBtu for Dutch TTF Pay up or cut down: Supply vs cost strategies Two hard-hit regions—Asia and Europe—show how the same shock can land unevenly. Both faced the same surge in prices and disruption risk, but the effects diverged sharply: → In emerging markets in Asia, resilience looked like conservation and demand destruction.6 In India, Pakistan, and Bangladesh, higher oil and LNG prices left governments with limited room to keep supplies flowing at normal levels. In each case, the near-term adjustment was not simply finding more fuel; it was using less. ◦ India used emergency powers to take tighter control of gas allocation to protect household supply, including overriding private arrangements, and diverted gas away from some industrial users such as fertilizer and steel. ◦ Bangladesh cut demand by shortening office hours and forcing earlier closing times for markets and shopping centers, alongside tighter limits on non-essential electricity use like decorative or excessive lighting. ◦ Pakistan focused on public-sector demand reduction by cutting government fuel allowances and shifting government offices to a four-day work week with roughly half of staff physically present on rotation. → In wealthier Asian countries, resilience showed up in budgets, inventories, and procurement muscle. Richer Asian importers faced the same price shock but had more tools to manage it and avoid curbing demand. Japan and South Korea could release
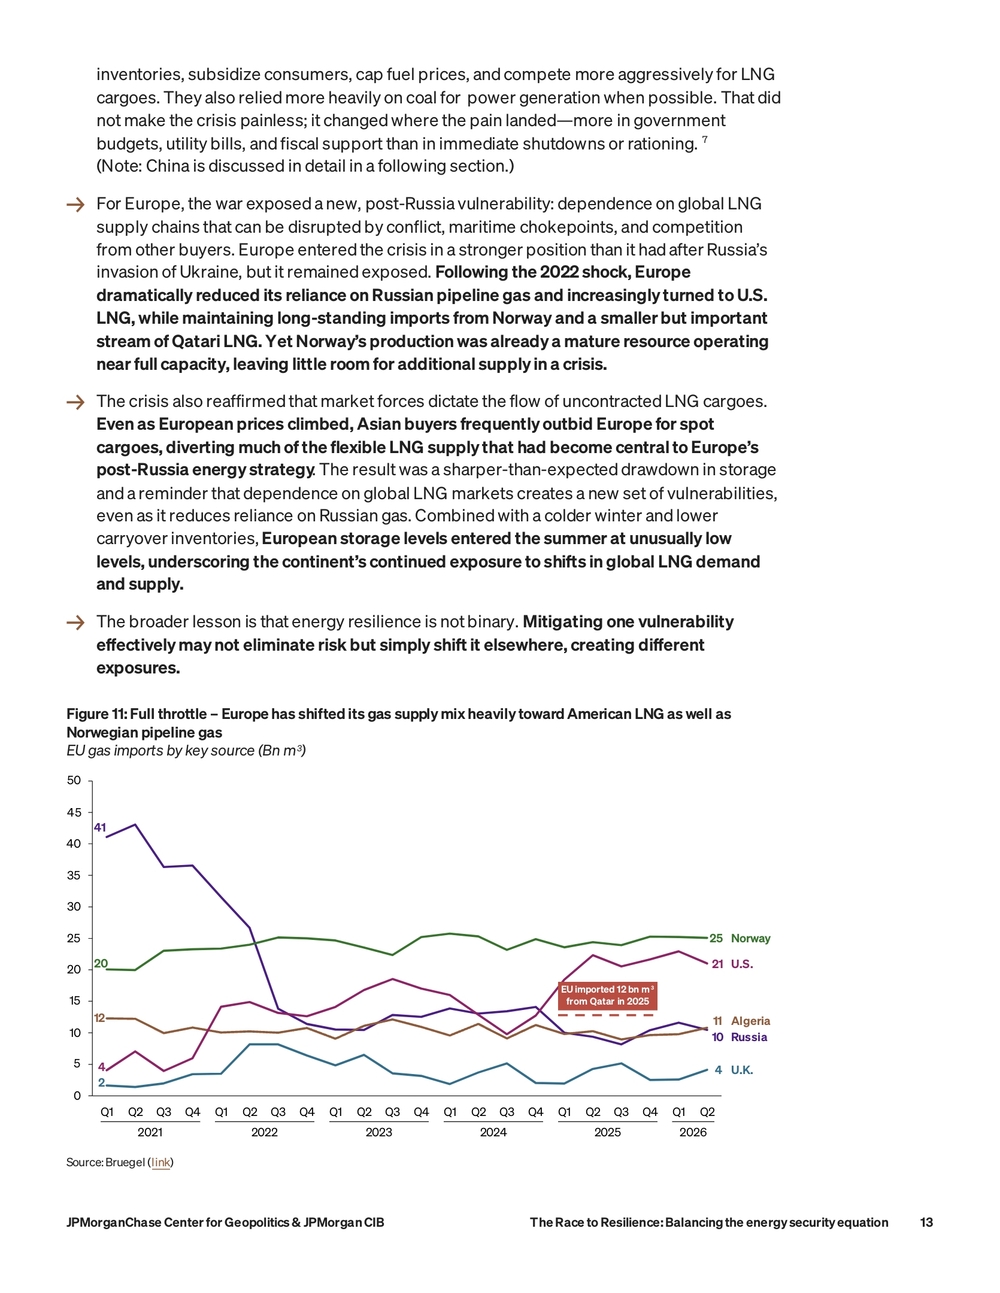
JPMorganChase Center for Geopolitics & JPMorgan CIB The Race to Resilience: Balancing the energy security equation13inventories, subsidize consumers, cap fuel prices, and compete more aggressively for LNG cargoes. They also relied more heavily on coal for power generation when possible. That did not make the crisis painless; it changed where the pain landed—more in government budgets, utility bills, and fiscal support than in immediate shutdowns or rationing.7 (Note: China is discussed in detail in a following section.) → For Europe, the war exposed a new, post-Russia vulnerability: dependence on global LNG supply chains that can be disrupted by conflict, maritime chokepoints, and competition from other buyers. Europe entered the crisis in a stronger position than it had after Russia’s invasion of Ukraine, but it remained exposed. Following the 2022 shock, Europe dramatically reduced its reliance on Russian pipeline gas and increasingly turned to U.S. LNG, while maintaining long-standing imports from Norway and a smaller but important stream of Qatari LNG. Y et Norway’s production was already a mature resource operating near full capacity, leaving little room for additional supply in a crisis. → The crisis also reaffirmed that market forces dictate the flow of uncontracted LNG cargoes. Even as European prices climbed, Asian buyers frequently outbid Europe for spot cargoes, diverting much of the flexible LNG supply that had become central to Europe’s post-Russia energy strategy . The result was a sharper-than-expected drawdown in storage and a reminder that dependence on global LNG markets creates a new set of vulnerabilities, even as it reduces reliance on Russian gas. Combined with a colder winter and lower carryover inventories, European storage levels entered the summer at unusually low levels, underscoring the continent’s continued exposure to shifts in global LNG demand and supply. → The broader lesson is that energy resilience is not binary. Mitigating one vulnerability effectively may not eliminate risk but simply shift it elsewhere, creating different exposures. Figure 11: Full throttle – Europe has shifted its gas supply mix heavily toward American LNG as well as Norwegian pipeline gas EU gas imports by key source (Bn m3) 41 10 20 25 12 11 4 21 2 4 0 5 10 15 20 25 30 35 40 45 50 2021 Q1 Q2 Q3 Q4 Q1 Q2 Q3 Q4 2022 Q1 Q2 Q3 Q4 2023 Q1 Q2 Q3 Q4 2024 Q1 Q2 Q3 Q4 2025 Q1 Q2 2026 EU imported 12 bn m3 from Qatar in 2025 Norway U.S. Russia U.K. Algeria Source: Bruegel ( link)
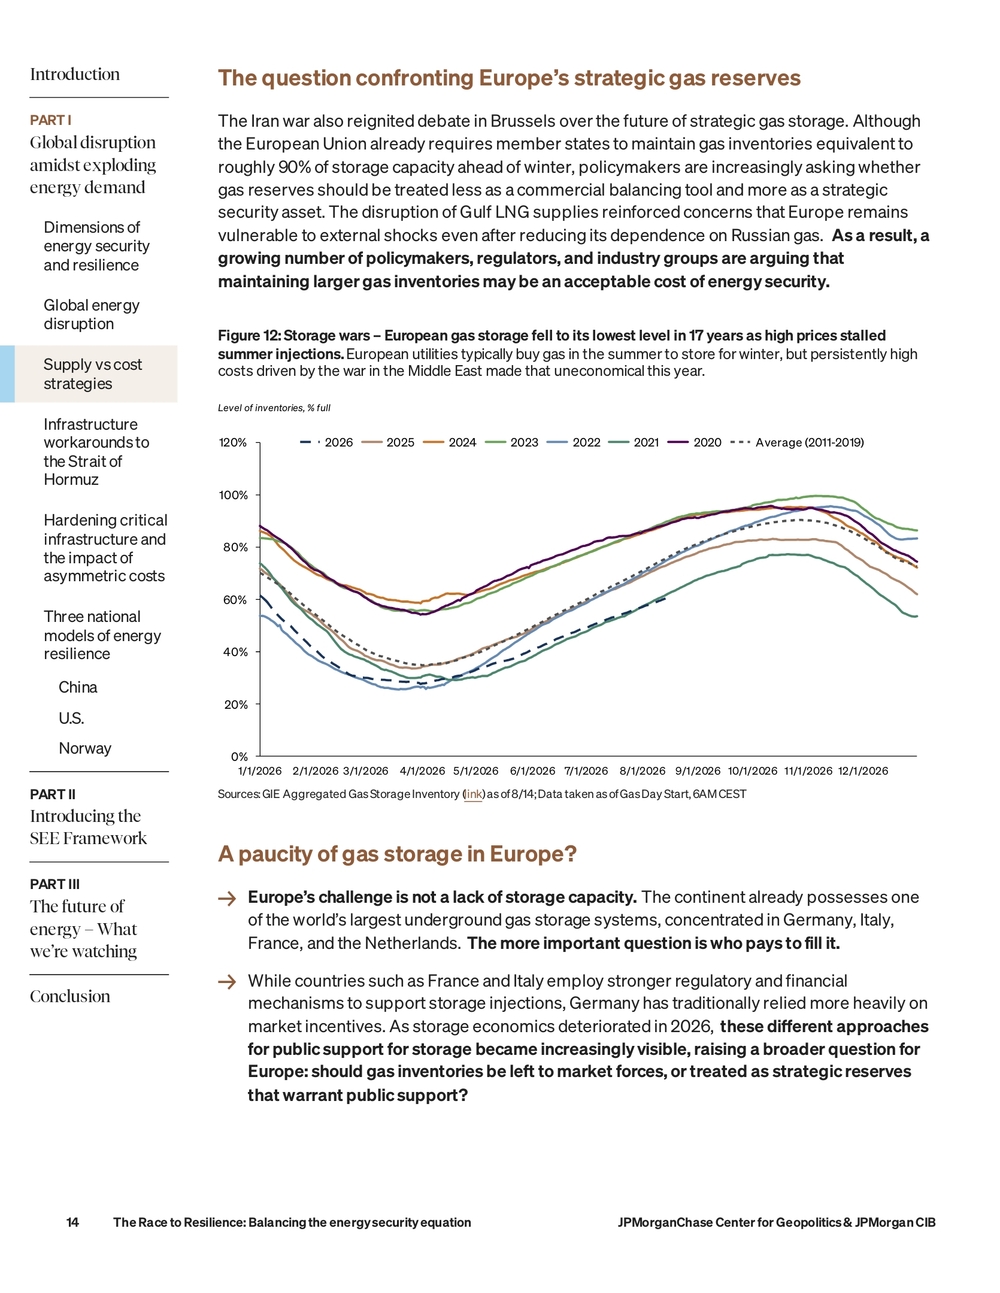
Introduction PART I Global disruption amidst exploding energy demand Dimensions of energy security and resilience Global energy disruption Supply vs cost strategies Infrastructure workarounds to the Strait of Hormuz Hardening critical infrastructure and the impact of asymmetric costs Three national models of energy resilience China U.S. Norway PART II Introducing the SEE Framework PART III The future of energy – What we’re watching Conclusion The Race to Resilience: Balancing the energy security equation JPMorganChase Center for Geopolitics & JPMorgan CIB 14The question confronting Europe’s strategic gas reserves The Iran war also reignited debate in Brussels over the future of strategic gas storage. Although the European Union already requires member states to maintain gas inventories equivalent to roughly 90% of storage capacity ahead of winter, policymakers are increasingly asking whether gas reserves should be treated less as a commercial balancing tool and more as a strategic security asset. The disruption of Gulf LNG supplies reinforced concerns that Europe remains vulnerable to external shocks even after reducing its dependence on Russian gas. As a result, a growing number of policymakers, regulators, and industry groups are arguing that maintaining larger gas inventories may be an acceptable cost of energy security. Figure 12: Storage wars – European gas storage fell to its lowest level in 17 years as high prices stalled summer injections. European utilities typically buy gas in the summer to store for winter, but persistently high costs driven by the war in the Middle East made that uneconomical this year. 0% 20% 40% 60% 80% 100% 120% 1/1/2026 2/1/2026 3/1/2026 4/1/2026 5/1/2026 6/1/2026 7/1/2026 8/1/2026 9/1/2026 10/1/2026 11/1/2026 12/1/2026 2026 2025 2024 2023 2022 2021 2020 Average (2011-2019) Level of inventories, % full Sources: GIE Aggregated Gas Storage Inventory ( link) as of 8/14; Data taken as of Gas Day Start, 6AM CEST A paucity of gas storage in Europe? → Europe’s challenge is not a lack of storage capacity. The continent already possesses one of the world’s largest underground gas storage systems, concentrated in Germany, Italy, France, and the Netherlands. The more important question is who pays to fill it. → While countries such as France and Italy employ stronger regulatory and financial mechanisms to support storage injections, Germany has traditionally relied more heavily on market incentives. As storage economics deteriorated in 2026, these different approaches for public support for storage became increasingly visible, raising a broader question for Europe: should gas inventories be left to market forces, or treated as strategic reserves that warrant public support?
JPMorganChase Center for Geopolitics & JPMorgan CIB The Race to Resilience: Balancing the energy security equation15 → Not every European country possesses suitable geology for large-scale storage. As a result, EU regulations require member states without domestic storage facilities to secure storage capacity abroad equivalent to at least 15% of annual gas consumption. In practice, this has reinforced the strategic importance of major storage hubs while creating a more integrated European system of shared storage obligations and cross-border reserve arrangements. Detours: Infrastructure workarounds to the Strait of Hormuz Alternative export pathways became one of the defining energy stories of the Iran war. As the Strait of Hormuz became effectively closed, countries and companies that had ways to move energy around, rather than through, the world’s most important oil chokepoint were better positioned. But, as we explore below, even these alternative export pathways still face threats, making it difficult to assert that there is a completely risk-free approach to bypassing the Strait of Hormuz. • No asset better captured the interplay of geography and redundancy than Saudi Arabia’s East-West Pipeline. As traffic through Hormuz collapsed, Saudi Arabia rerouted crude across the Arabian Peninsula to the Red Sea port of Yanbu. Exports through Yanbu port surged to approximately 5 million barrels per day , while the East-West pipeline reached its full 7 million barrels per day capacity , allowing the kingdom to bypass the Strait altogether. The crisis transformed the line from contingency infrastructure into a primary export corridor and highlighted the premium investors now place on energy routes that supplement geopolitical chokepoints. • The UAE’s Fujairah corridor became one of the biggest beneficiaries of the Hormuz disruption. Located outside the Strait on the Gulf of Oman, Fujairah provides Gulf producers with direct access to global markets without transiting Iranian-controlled waters. Flows through the Habshan-Fujairah Pipeline jumped from about 1 million barrels per day before the war to 1.8 million barrels per day during the crisis. ◦ The UAE is already investing heavily in additional bypass capacity. ADNOC, the state- owned oil company that produces most of Abu Dhabi’s crude, says it has completed nearly half of a second Fujairah pipeline. Once operational in 2027, the line is expected to roughly double the UAE’s export capacity outside the Strait of Hormuz. • Oman also benefited from its geography outside Hormuz. Ports such as Duqm and Sohar are located on Oman’s Arabian Sea and Gulf of Oman coastlines rather than inside the Persian Gulf, making them attractive alternatives for storage, refining, and transshipment. Duqm, in particular, has been developed as an integrated energy hub, combining deep- water port facilities with large-scale refining, storage, and industrial infrastructure. • The ripple effects extended beyond the Gulf. As more crude was redirected toward Saudi Arabia’s Red Sea coast, infrastructure farther downstream also grew in strategic importance. Egypt’s SUMED pipeline, which links the Red Sea to the Mediterranean, offers a critical route for moving crude to European markets and could see greater utilization if Red Sea export volumes continue to rise.
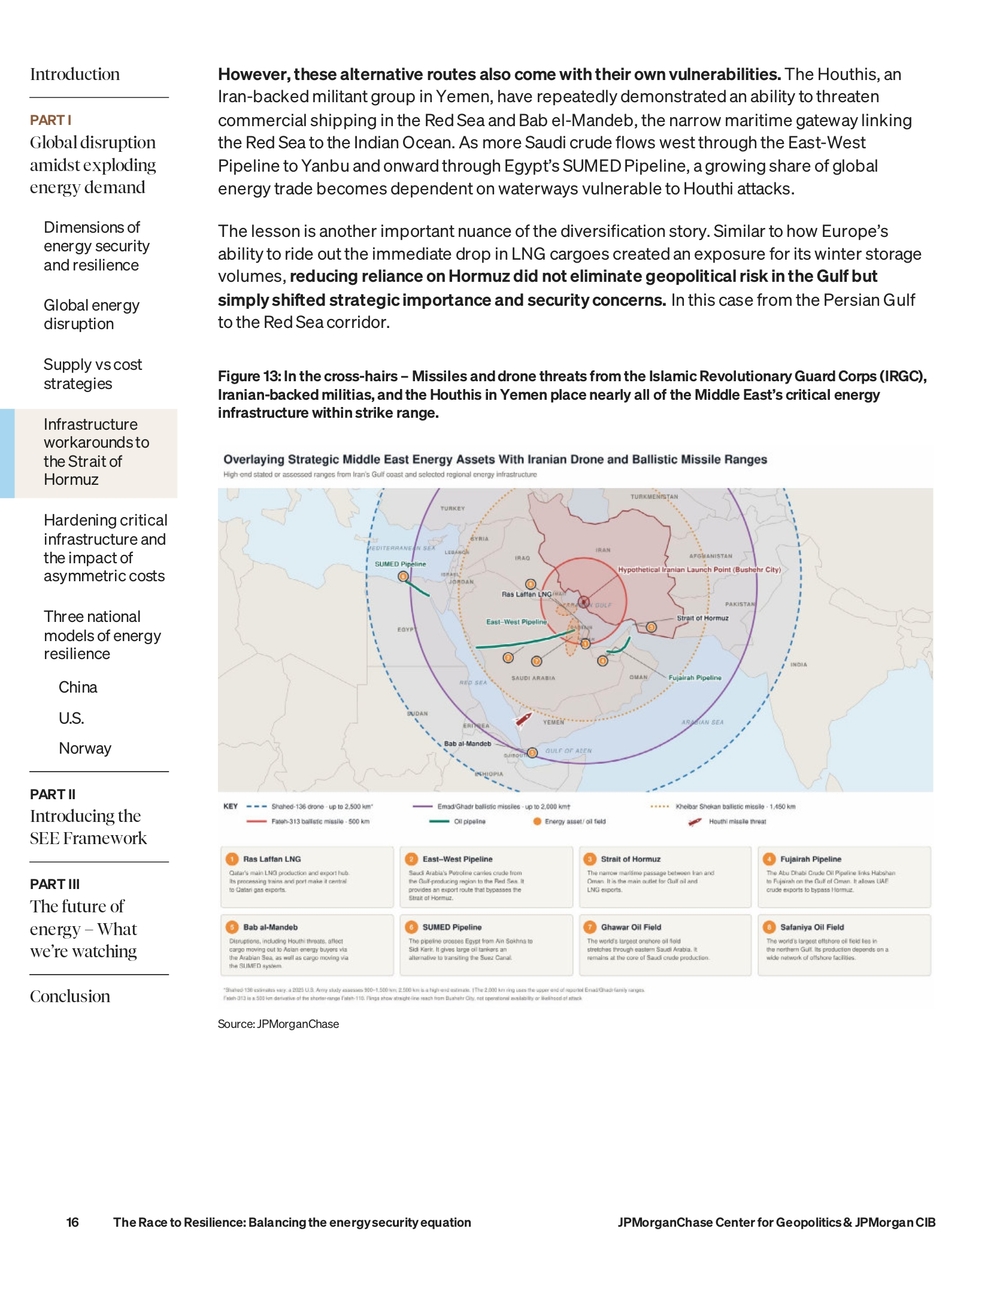
Introduction PART I Global disruption amidst exploding energy demand Dimensions of energy security and resilience Global energy disruption Supply vs cost strategies Infrastructure workarounds to the Strait of Hormuz Hardening critical infrastructure and the impact of asymmetric costs Three national models of energy resilience China U.S. Norway PART II Introducing the SEE Framework PART III The future of energy – What we’re watching Conclusion The Race to Resilience: Balancing the energy security equation JPMorganChase Center for Geopolitics & JPMorgan CIB 16However, these alternative routes also come with their own vulnerabilities. The Houthis, an Iran-backed militant group in Yemen, have repeatedly demonstrated an ability to threaten commercial shipping in the Red Sea and Bab el-Mandeb, the narrow maritime gateway linking the Red Sea to the Indian Ocean. As more Saudi crude flows west through the East-West Pipeline to Yanbu and onward through Egypt’s SUMED Pipeline, a growing share of global energy trade becomes dependent on waterways vulnerable to Houthi attacks. The lesson is another important nuance of the diversification story. Similar to how Europe’s ability to ride out the immediate drop in LNG cargoes created an exposure for its winter storage volumes, reducing reliance on Hormuz did not eliminate geopolitical risk in the Gulf but simply shifted strategic importance and security concerns. In this case from the Persian Gulf to the Red Sea corridor. Figure 13: In the cross-hairs – Missiles and drone threats from the Islamic Revolutionary Guard Corps (IRGC), Iranian-backed militias, and the Houthis in Y emen place nearly all of the Middle East’s critical energy infrastructure within strike range. Source: JPMorganChase
JPMorganChase Center for Geopolitics & JPMorgan CIB The Race to Resilience: Balancing the energy security equation17Hardening critical infrastructure and the impact of asymmetric costs: Physical and cyber vulnerabilities Another pathway for energy resilience is to harden critical infrastructure against potential physical damage—either from munitions or extreme weather events. However, a defining infrastructure lesson of the Iran war is asymmetry . Adversaries no longer need to match the cost of the assets they target. Missiles, drones, and cyber tools costing thousands or millions of dollars can threaten infrastructure worth tens of billions. And physical proximity is not a limiting factor for all retaliations. Cyberattack capabilities can extend the reach of an adversary beyond its missile range. And while physical climate impacts were not the cause of this supply disruption the same lesson applies—increasingly frequent and severe extreme weather events can have large tail-risks for energy infrastructure and transportation. • Iran’s attacks on Qatar’s Ras Laffan LNG complex were a textbook example of cost- imposition asymmetry. A drone or missile that may cost anywhere from tens of thousands of dollars to low single-digit millions can impose damage measured in tens of billions. Iranian strikes knocked out roughly 17% of Qatar’s LNG export capacity , creating an estimated $20 billion per year in lost revenue. • The Iran war also highlights cyber’s transnational threat to critical infrastructure. Even as the conflict unfolded more than 7,000 miles away in the Middle East, suspected Iranian- linked cyber activity reached water and wastewater utilities in Minnesota and several other states.8 The episode underscored a broader lesson from the war: critical infrastructure resilience is no longer just about protecting assets from physical attacks such as missiles and drones, but also safeguarding the digital systems that keep essential services running. • The increasing frequency and severity of extreme weather and climate events also reveals previously rarely experienced or entirely new vulnerabilities. ◦ Low precipitation values and climate change-enhanced heatwaves have reduced water levels in freshwater riverbeds used for oil and gas tankers, compounding the supply chain disruptions of the Strait of Hormuz closure . As of August 2026, weight restrictions have removed transport capacity through the Panama Canal, the Rhine in Germany and the Netherlands, and the Danube in Central & Eastern Europe. This will drive various resilience measures: infrastructure (re)construction, nature-based solutions to improve water retention, and/or transportation route substitution. ◦ The heat has also hit energy supplies: Romania began disconnecting its sole functioning nuclear reactor from the grid because of record low levels of water in the Danube, while a fifth of France’s nuclear capacity is offline.9 In the U.S., after record low snowpack values in the winter of 2025-26 and several record-breaking heat domes starting in the spring, surface waters have evaporated, plunging Lake Mead levels to record lows.10 The minimum power pool, where turbines are left dry and hydropower production ends, could be reached in the next year if El Niño fails to bring record-breaking rainfall and snowfall to the region. The typical Colorado River Basin wet season begins in October.
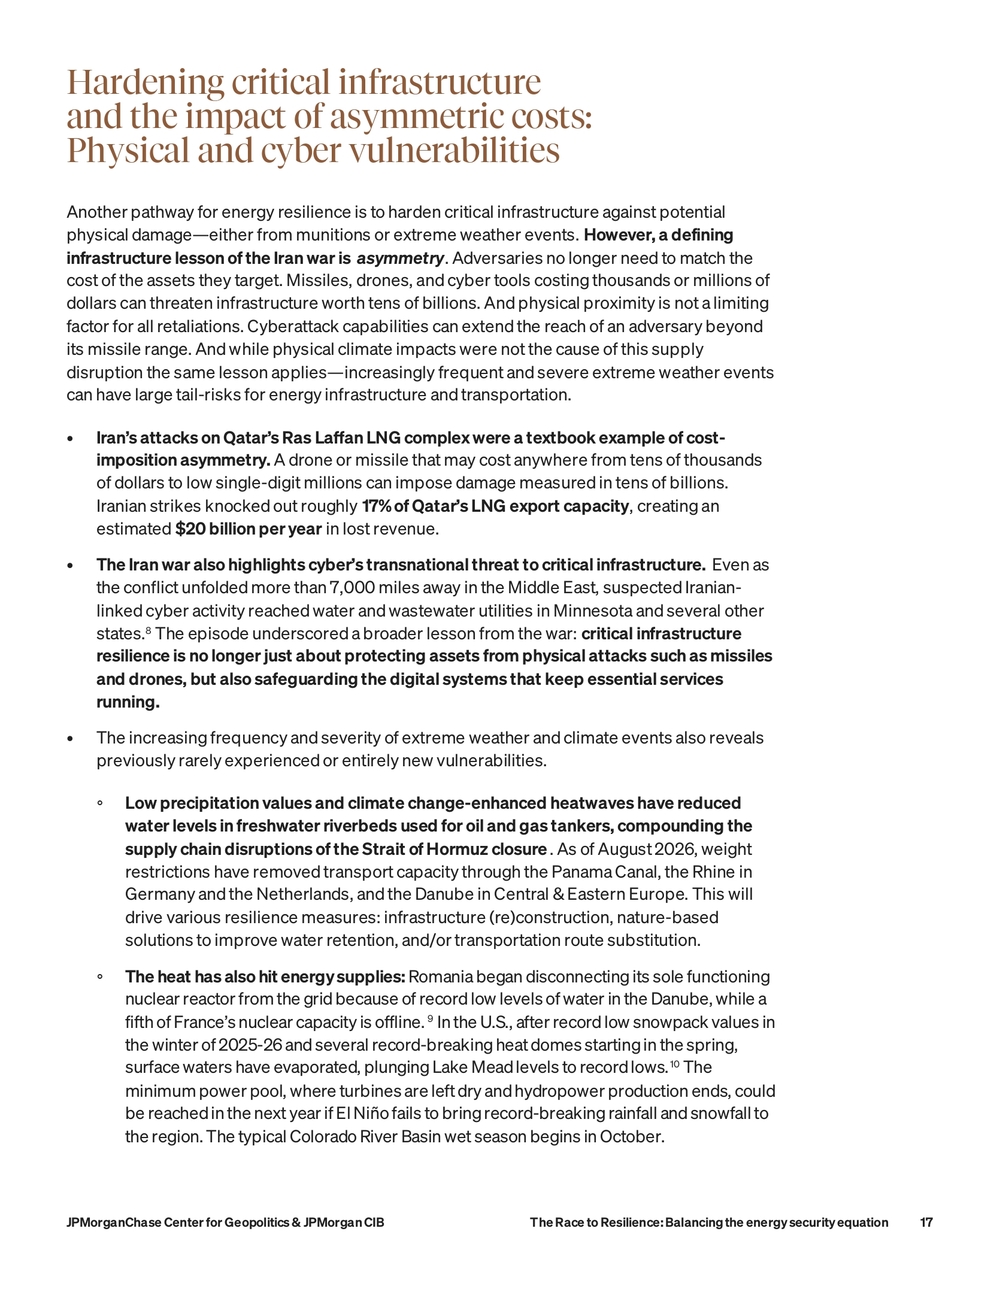
Introduction PART I Global disruption amidst exploding energy demand Dimensions of energy security and resilience Global energy disruption Supply vs cost strategies Infrastructure workarounds to the Strait of Hormuz Hardening critical infrastructure and the impact of asymmetric costs Three national models of energy resilience China U.S. Norway PART II Introducing the SEE Framework PART III The future of energy – What we’re watching Conclusion The Race to Resilience: Balancing the energy security equation JPMorganChase Center for Geopolitics & JPMorgan CIB 18• On a more extreme level, if supply chain disruptions last long enough, entire goods may be substituted (e.g. favoring domestic nuclear requiring less frequent fuel delivery vs far-flung fossil fuels). Mother Nature can grind commerce to a halt without resilience planning to handle increasing volatility and extreme events. This will happen as long as emissions accumulate in the atmosphere. Three national models of energy resilience during the Iran war How China, the U.S., and Norway weathered the crisis through different strengths The previous sections examined key dimensions of energy resilience, resilience strategies used in the immediate aftermath of the disruption (e.g. paying up, cutting down, and working around), and the vulnerabilities of those strategies as exposed by the Iran war. The following cases highlight examples where resilience fared more favorably. T ogether, they demonstrate that energy security is not a switch that can be turned on when a disruption occurs countries that fared relatively favorably in 2026 did not choose one fuel and shut off others. Rather, they already had, and maintained, alternatives which had been developed over decades of investment and policy choices. • China leaned on stockpiles and fuel switching, and benefited from its efforts to electrify; • The U.S. relied on strong domestic fossil fuel production and secure regional supply links; • Finally, Norway benefited from the fact that it has domestically insulated oil and gas infrastructure, highly electrified households, and a well-developed hydro-powered economy. Source: JPMorganChase
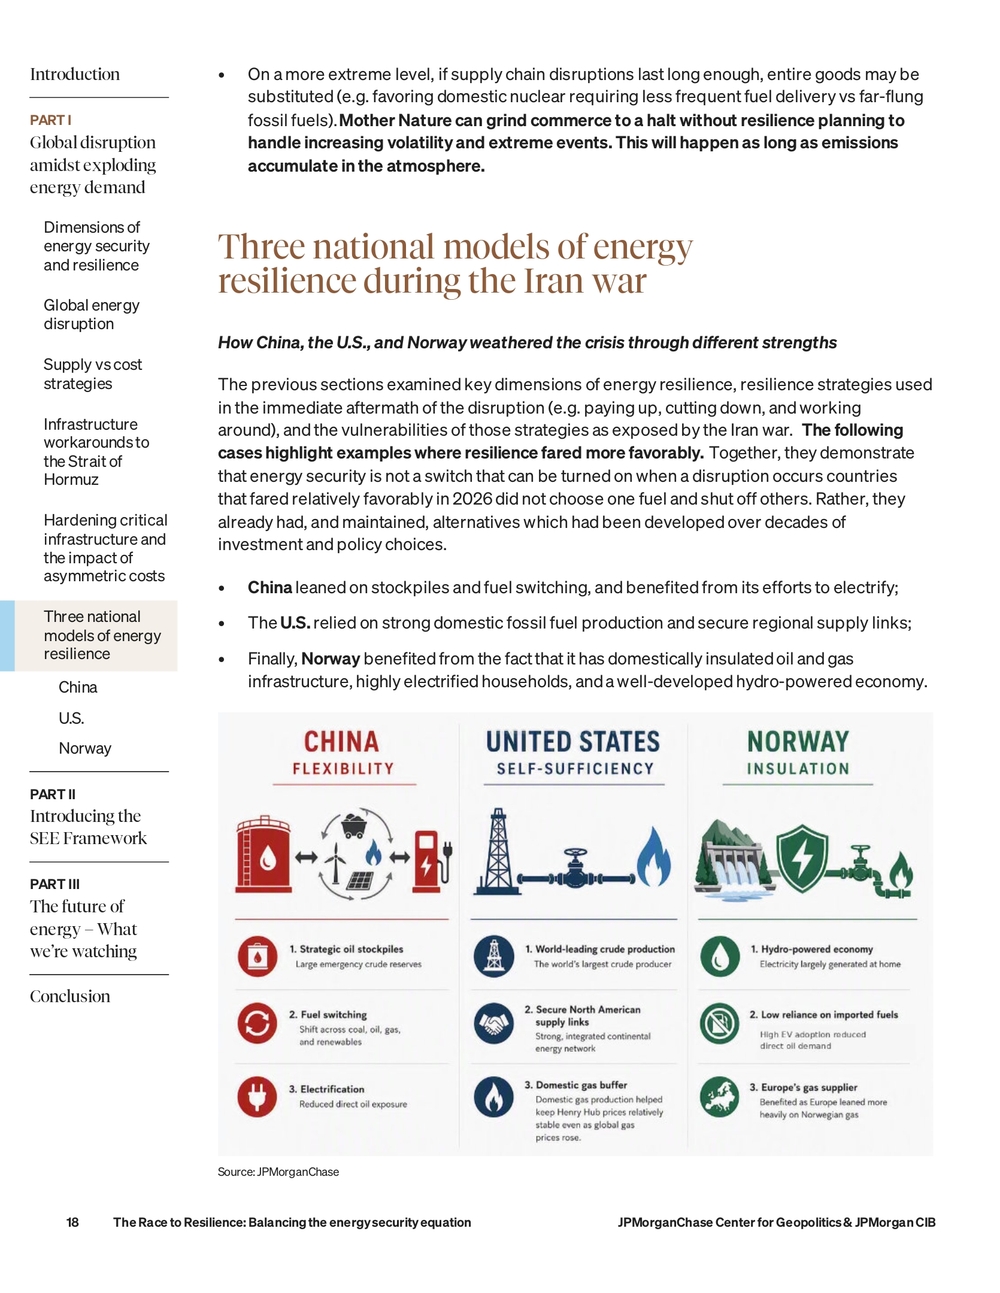
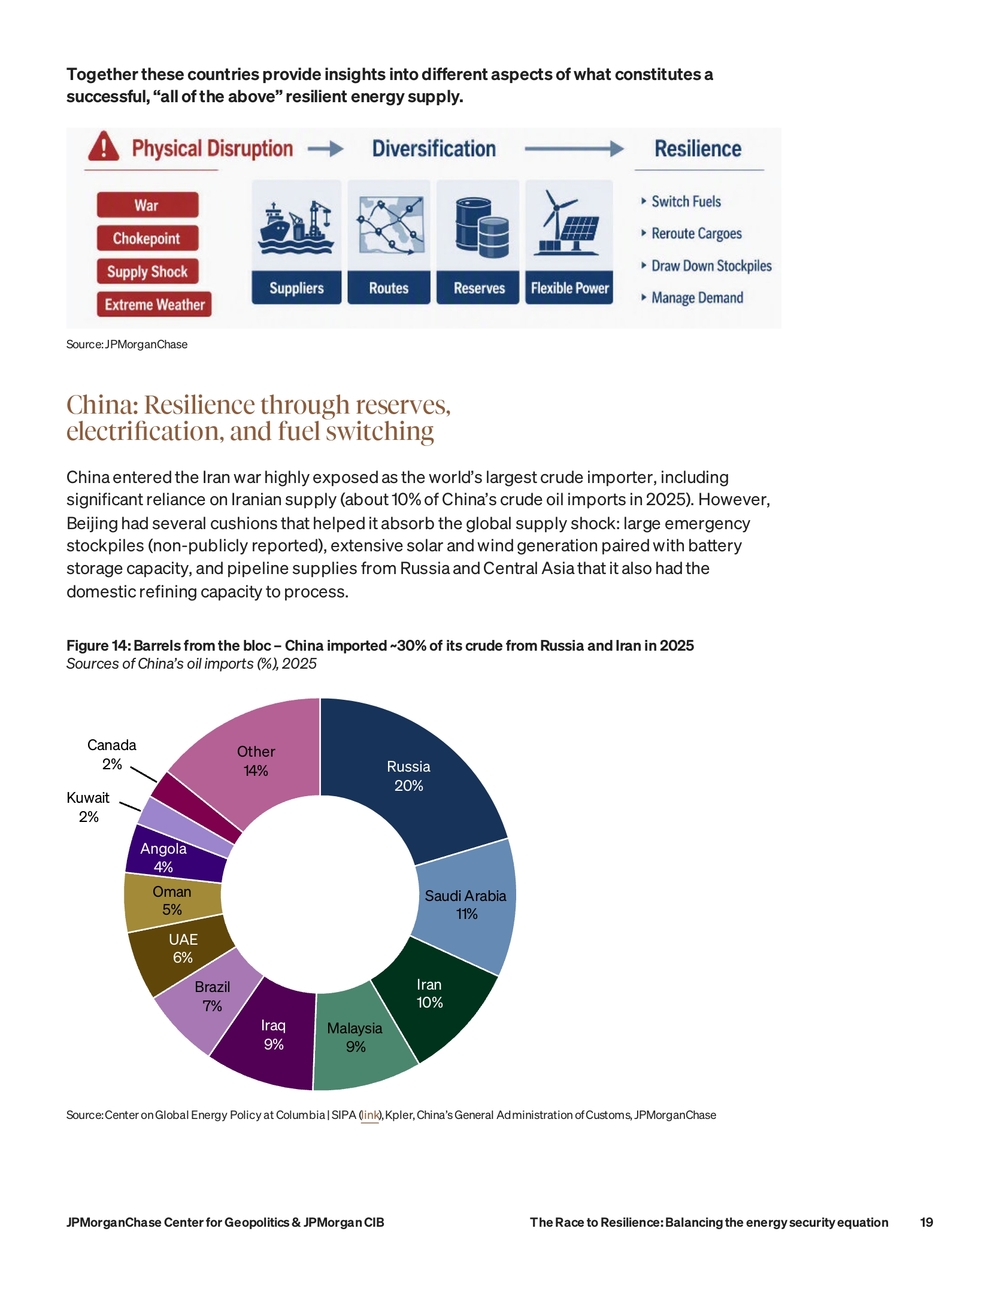
JPMorganChase Center for Geopolitics & JPMorgan CIB The Race to Resilience: Balancing the energy security equation19T ogether these countries provide insights into different aspects of what constitutes a successful, “all of the above” resilient energy supply. Source: JPMorganChase China: Resilience through reserves, electrification, and fuel switching China entered the Iran war highly exposed as the world’s largest crude importer, including significant reliance on Iranian supply (about 10% of China’s crude oil imports in 2025). However, Beijing had several cushions that helped it absorb the global supply shock: large emergency stockpiles (non-publicly reported), extensive solar and wind generation paired with battery storage capacity, and pipeline supplies from Russia and Central Asia that it also had the domestic refining capacity to process. Figure 14: Barrels from the bloc – China imported ~30% of its crude from Russia and Iran in 2025 Sources of China’s oil imports (%), 2025 Russia 20% Saudi Arabia 11% Iran 10% Malaysia 9% Iraq 9% Brazil 7% UAE 6% Oman 5% Angola 4% Kuwait 2% Canada 2% Other 14% Source: Center on Global Energy Policy at Columbia | SIPA ( link), Kpler, China’s General Administration of Customs, JPMorganChase
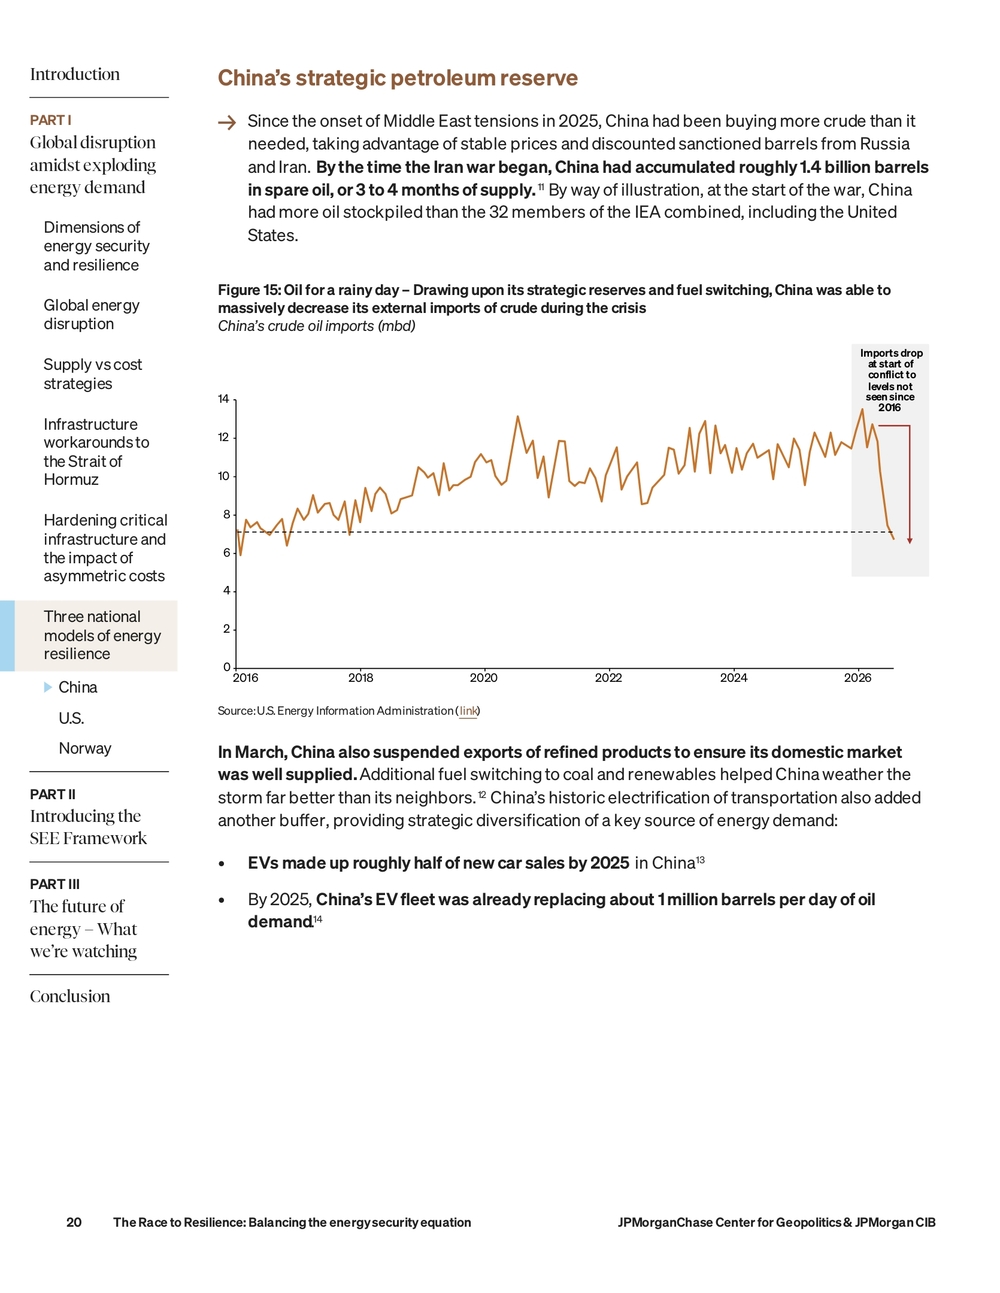
Introduction PART I Global disruption amidst exploding energy demand Dimensions of energy security and resilience Global energy disruption Supply vs cost strategies Infrastructure workarounds to the Strait of Hormuz Hardening critical infrastructure and the impact of asymmetric costs Three national models of energy resilience China U.S. Norway PART II Introducing the SEE Framework PART III The future of energy – What we’re watching Conclusion The Race to Resilience: Balancing the energy security equation JPMorganChase Center for Geopolitics & JPMorgan CIB 20China’s strategic petroleum reserve → Since the onset of Middle East tensions in 2025, China had been buying more crude than it needed, taking advantage of stable prices and discounted sanctioned barrels from Russia and Iran. By the time the Iran war began, China had accumulated roughly 1.4 billion barrels in spare oil, or 3 to 4 months of supply.11 By way of illustration, at the start of the war, China had more oil stockpiled than the 32 members of the IEA combined, including the United States. Figure 15: Oil for a rainy day – Drawing upon its strategic reserves and fuel switching, China was able to massively decrease its external imports of crude during the crisis China’s crude oil imports (mbd) 0 2 4 6 8 10 12 14 2016 2018 2020 2022 2024 2026 Imports drop at start of conflict to levels not seen since 2016
Source: U.S. Energy Information Administration ( link) In March, China also suspended exports of refined products to ensure its domestic market was well supplied. Additional fuel switching to coal and renewables helped China weather the storm far better than its neighbors.12 China’s historic electrification of transportation also added another buffer, providing strategic diversification of a key source of energy demand: • EVs made up roughly half of new car sales by 2025 in China13 • By 2025, China’s EV fleet was already replacing about 1 million barrels per day of oil demand .14
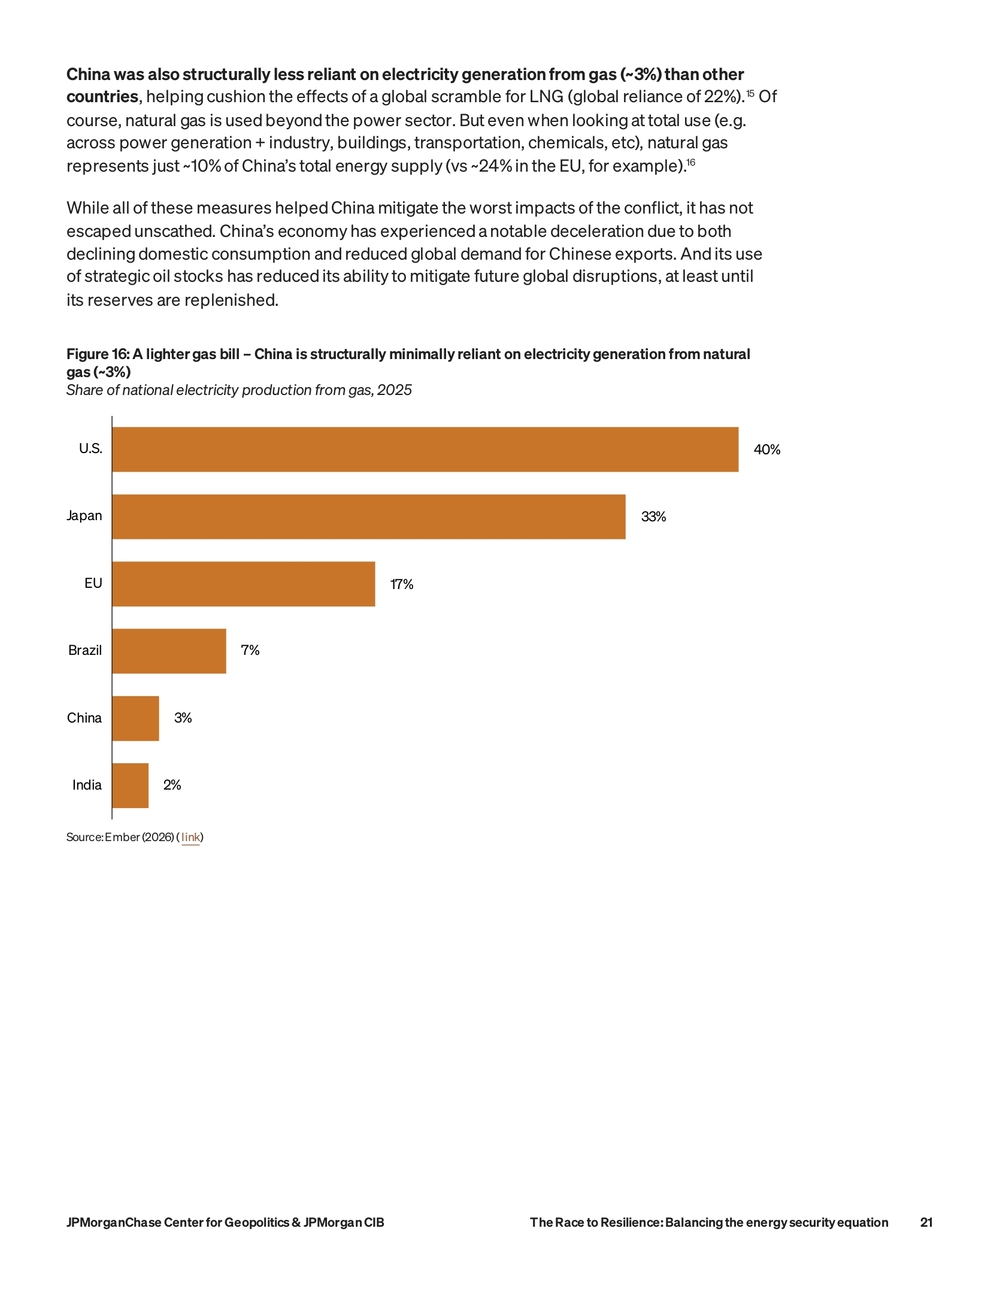
JPMorganChase Center for Geopolitics & JPMorgan CIB The Race to Resilience: Balancing the energy security equation21China was also structurally less reliant on electricity generation from gas (~3%) than other countries , helping cushion the effects of a global scramble for LNG (global reliance of 22%).15 Of course, natural gas is used beyond the power sector. But even when looking at total use (e.g. across power generation + industry, buildings, transportation, chemicals, etc), natural gas represents just ~10% of China’s total energy supply (vs ~24% in the EU, for example).16 While all of these measures helped China mitigate the worst impacts of the conflict, it has not escaped unscathed. China’s economy has experienced a notable deceleration due to both declining domestic consumption and reduced global demand for Chinese exports. And its use of strategic oil stocks has reduced its ability to mitigate future global disruptions, at least until its reserves are replenished. Figure 16: A lighter gas bill – China is structurally minimally reliant on electricity generation from natural gas (~3%) Share of national electricity production from gas, 2025 40% 33% 17% 7% 3% 2% U.S. Japan EU Brazil China India Source: Ember (2026) ( link)
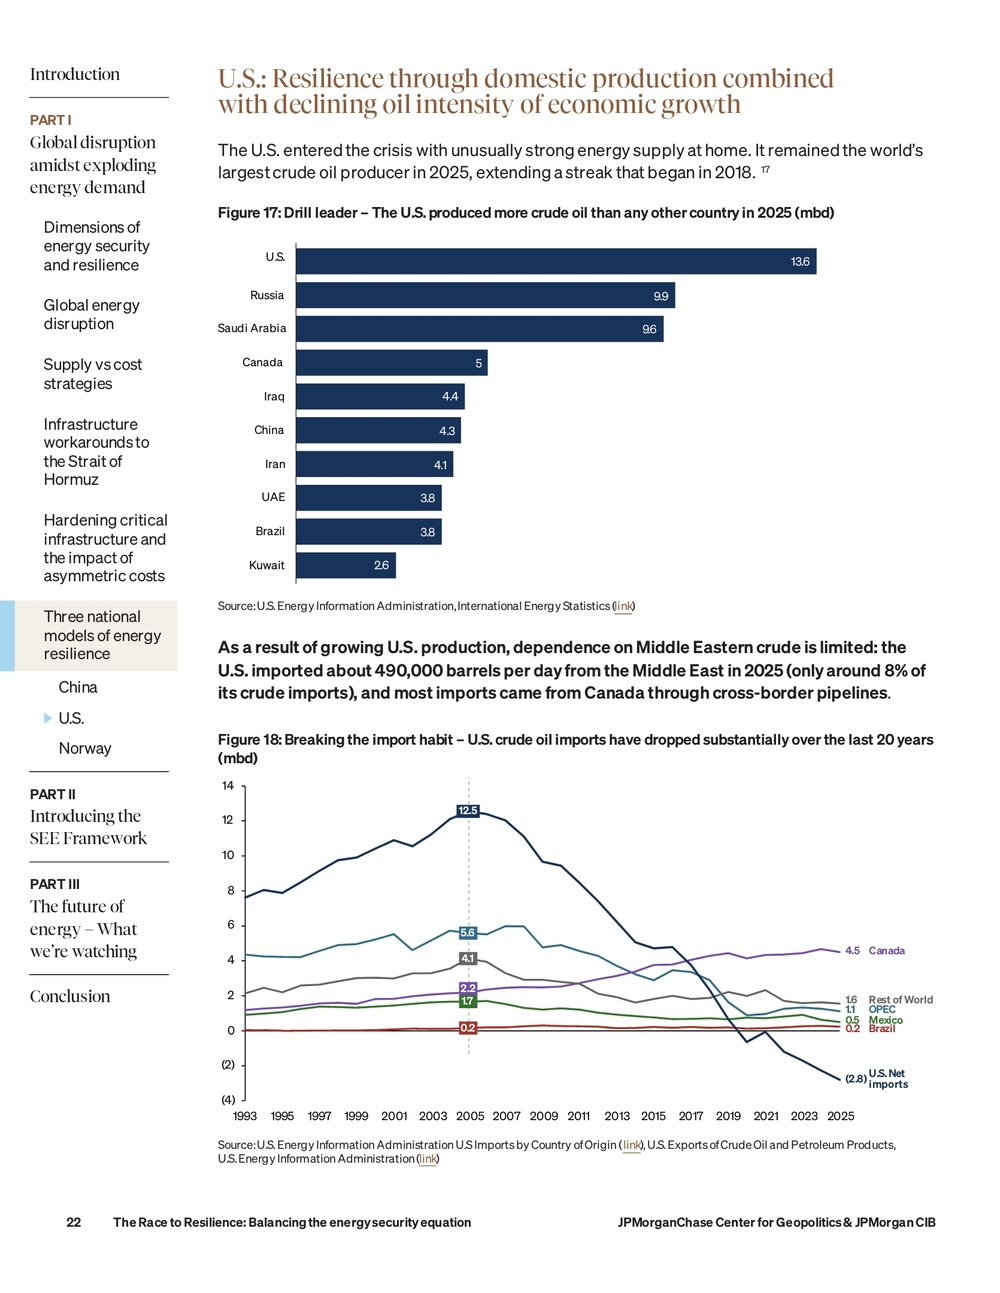
Introduction PART I Global disruption amidst exploding energy demand Dimensions of energy security and resilience Global energy disruption Supply vs cost strategies Infrastructure workarounds to the Strait of Hormuz Hardening critical infrastructure and the impact of asymmetric costs Three national models of energy resilience China U.S. Norway PART II Introducing the SEE Framework PART III The future of energy – What we’re watching Conclusion The Race to Resilience: Balancing the energy security equation JPMorganChase Center for Geopolitics & JPMorgan CIB 22U.S.: Resilience through domestic production combined with declining oil intensity of economic growth The U.S. entered the crisis with unusually strong energy supply at home. It remained the world’s largest crude oil producer in 2025, extending a streak that began in 2018.17 Figure 17: Drill leader – The U.S. produced more crude oil than any other country in 2025 (mbd) 13.6 9.9 9.6 5 4.4 4.3 4.1 3.8 3.8 2.6 U.S. Russia Saudi Arabia Canada Iraq China Iran UAE Brazil Kuwait Source: U.S. Energy Information Administration, International Energy Statistics ( link) As a result of growing U.S. production, dependence on Middle Eastern crude is limited: the U.S. imported about 490,000 barrels per day from the Middle East in 2025 (only around 8% of its crude imports), and most imports came from Canada through cross-border pipelines . Figure 18: Breaking the import habit – U.S. crude oil imports have dropped substantially over the last 20 years (mbd) 5.6 1.1 0.2 0.2 2.2 4.5 1.7 0.5 4.1 1.6 12.5 (2.8) (4) (2) 0 2 4 6 8 10 12 14 1993 1995 1997 1999 2001 2003 2005 2007 2009 2011 2013 2015 2017 2019 2021 2023 2025 U.S. Net imports OPEC Canada Rest of World Mexico Brazil Source: U.S. Energy Information Administration U.S Imports by Country of Origin ( link), U.S. Exports of Crude Oil and Petroleum Products, U.S. Energy Information Administration ( link)
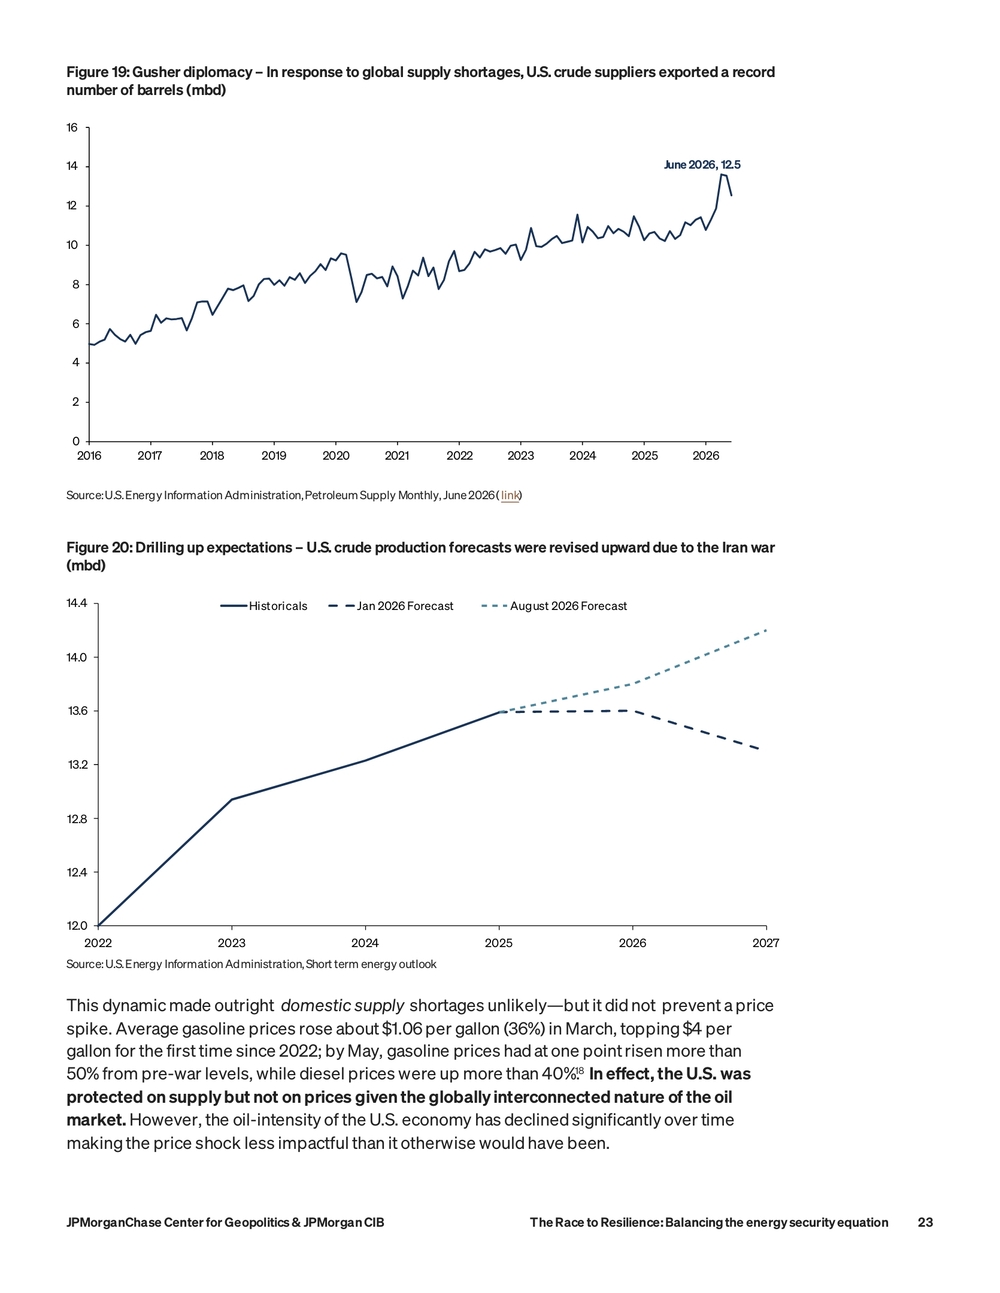
JPMorganChase Center for Geopolitics & JPMorgan CIB The Race to Resilience: Balancing the energy security equation23Figure 19: Gusher diplomacy – In response to global supply shortages, U.S. crude suppliers exported a record number of barrels (mbd) June 2026, 12.5 0 2 4 6 8 10 12 14 16 2016 2017 2018 2019 2020 2021 2022 2023 2024 2025 2026 Source: U.S. Energy Information Administration, Petroleum Supply Monthly, June 2026 ( link) Figure 20: Drilling up expectations – U.S. crude production forecasts were revised upward due to the Iran war (mbd) 12.0 12.4 12.8 13.2 13.6 14.0 14.4 2022 2023 2024 2025 2026 2027 Historicals Jan 2026 Forecast August 2026 Forecast
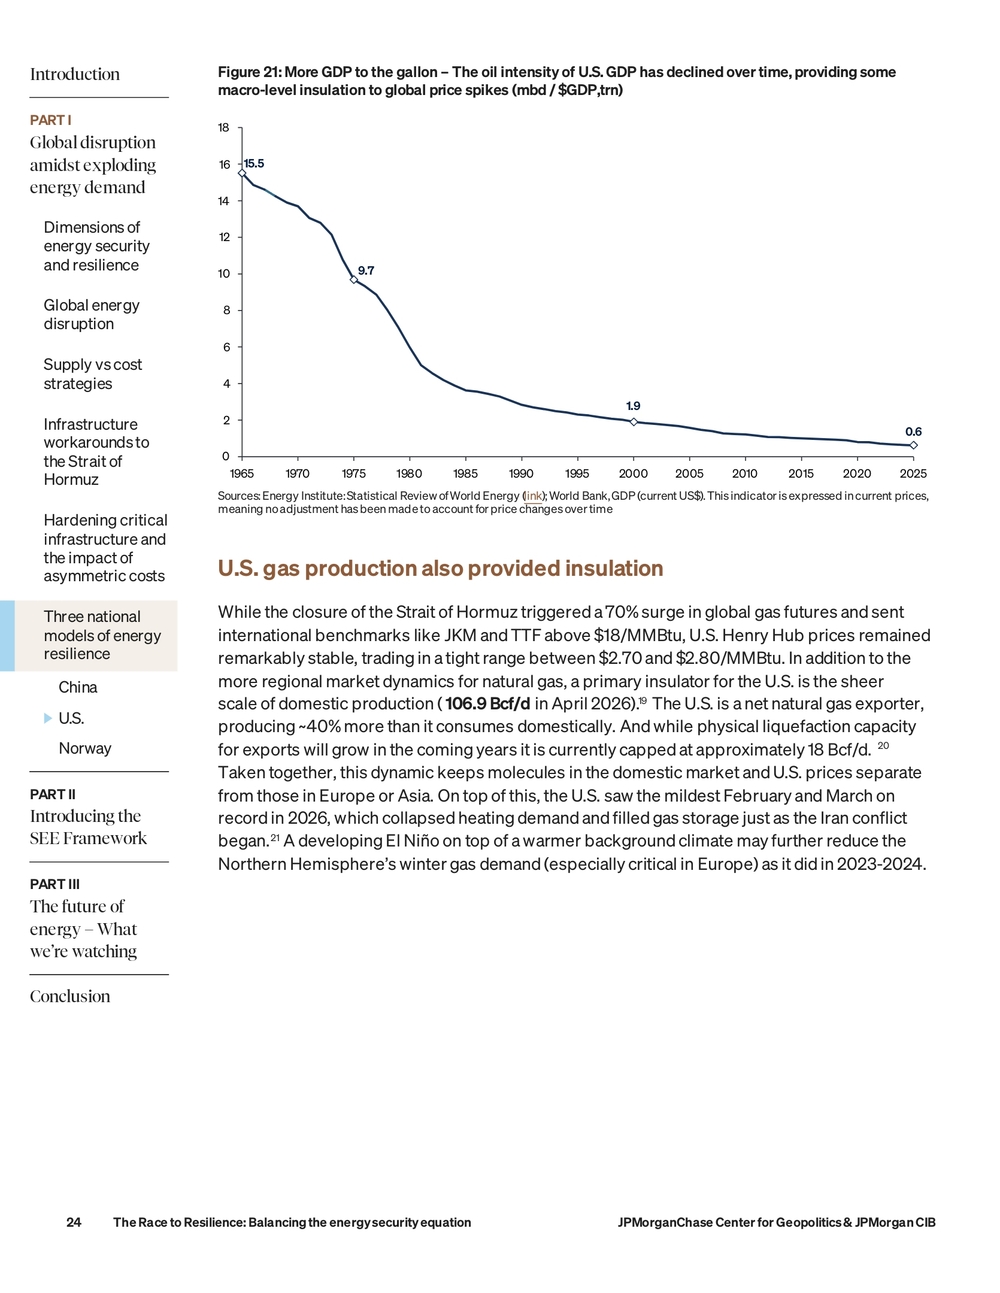
Source: U.S. Energy Information Administration, Short term energy outlook This dynamic made outright domestic supply shortages unlikely—but it did not prevent a price spike. Average gasoline prices rose about $1.06 per gallon (36%) in March, topping $4 per gallon for the first time since 2022; by May, gasoline prices had at one point risen more than 50% from pre-war levels, while diesel prices were up more than 40%.18 In effect, the U.S. was protected on supply but not on prices given the globally interconnected nature of the oil market. However, the oil-intensity of the U.S. economy has declined significantly over time making the price shock less impactful than it otherwise would have been.
Introduction PART I Global disruption amidst exploding energy demand Dimensions of energy security and resilience Global energy disruption Supply vs cost strategies Infrastructure workarounds to the Strait of Hormuz Hardening critical infrastructure and the impact of asymmetric costs Three national models of energy resilience China U.S. Norway PART II Introducing the SEE Framework PART III The future of energy – What we’re watching Conclusion The Race to Resilience: Balancing the energy security equation JPMorganChase Center for Geopolitics & JPMorgan CIB 24Figure 21: More GDP to the gallon – The oil intensity of U.S. GDP has declined over time, providing some macro-level insulation to global price spikes (mbd / $GDP,trn) 15.5 9.7 1.9 0.6 0 2 4 6 8 10 12 14 16 18 1965 1970 1975 1980 1985 1990 1995 2000 2005 2010 2015 2020 2025 Sources: Energy Institute: Statistical Review of World Energy ( link); World Bank, GDP (current US$). This indicator is expressed in current prices, meaning no adjustment has been made to account for price changes over time U.S. gas production also provided insulation While the closure of the Strait of Hormuz triggered a 70% surge in global gas futures and sent international benchmarks like JKM and TTF above $18/MMBtu, U.S. Henry Hub prices remained remarkably stable, trading in a tight range between $2.70 and $2.80/MMBtu. In addition to the more regional market dynamics for natural gas, a primary insulator for the U.S. is the sheer scale of domestic production ( 106.9 Bcf/d in April 2026).19 The U.S. is a net natural gas exporter, producing ~40% more than it consumes domestically. And while physical liquefaction capacity for exports will grow in the coming years it is currently capped at approximately 18 Bcf/d.20 Taken together, this dynamic keeps molecules in the domestic market and U.S. prices separate from those in Europe or Asia. On top of this, the U.S. saw the mildest February and March on record in 2026, which collapsed heating demand and filled gas storage just as the Iran conflict began.21 A developing El Niño on top of a warmer background climate may further reduce the Northern Hemisphere’s winter gas demand (especially critical in Europe) as it did in 2023-2024.
JPMorganChase Center for Geopolitics & JPMorgan CIB The Race to Resilience: Balancing the energy security equation25Norway: Resilience derived through domestic renewable resources (hydropower) and EVs Historical policy choices, a commitment to environmental preservation, and market forces have all shaped Norway’s current energy landscape. The resulting insulation from global oil and gas markets has occurred despite the fact that Norway is a leading global producer of oil and gas. Norway has certain characteristics (e.g. high wealth per capita, large sovereign wealth fund, small population, vast domestic hydro resource) that make its specific resilience pathway unlikely to be easily replicable in every part of the world. Nevertheless , Norway serves as an example of how national policy choices can leverage natural resources to build systems that are insulated from fossil fuel disruptions, even when a country has significant oil and gas reserves and production capacity . An emerging new example of this is the development of nuclear facilities in oil and gas rich United Arab Emirates. T o be clear, Norway was not immune to global prices, but the shock reached the country mainly as a price and trade disturbance, not as a threat to physical energy availability. Indeed, Norway was one of the few European countries positioned to benefit fiscally from the crisis. A number of geological, hydrological, and geographical factors made Norway unusually favorable: • Almost no direct dependence on Gulf supplies. Norway produces far more oil and gas than it consumes. In 2025, it produced roughly 2 million barrels per day of liquids and exported about 1.5 million barrels per day of crude alone.22 A disruption of Gulf production therefore did not threaten Norway with domestic oil or gas shortages. • Robust domestic oil and gas production outside the conflict geography. Norway’s fields, terminals and pipelines are concentrated in the North, Norwegian and Barents seas. Its exports move directly into northwestern Europe through pipelines or Atlantic and North Sea shipping routes. They do not pass through Hormuz, Bab al-Mandab or Suez, insulating Norwegian supplies from the war’s principal maritime chokepoints. • An overwhelmingly renewable electricity system. Hydropower supplies around 89% of Norway’s electricity, with wind and other renewable sources bringing the total renewable share to approximately 98%.23 Norway therefore does not depend on imported oil or gas to keep its power system running. • Large reservoirs that make hydropower dispatchable. Norway’s roughly 1,100 hydropower reservoirs can store more than 87 TWh of energy, equal to around half of Europe’s total reservoir-storage capacity.24 This allows Norway to hold water for periods of increased demand and rapidly increase or reduce generation. More than 75% of its power-production capacity is flexible, making Norwegian hydropower dispatchable rather than merely weather-dependent and helping Norway balance both its own electricity system and neighboring European grids. • Lower household exposure to fossil fuels. Electricity supplies 83% of Norwegian household energy consumption, compared with 28% across Europe.25 Electric vehicles also dominate new passenger-car sales. Norwegian households remained exposed to higher electricity and transport prices, but electrification weakened the direct transmission of the global oil shock into heating and household driving costs.
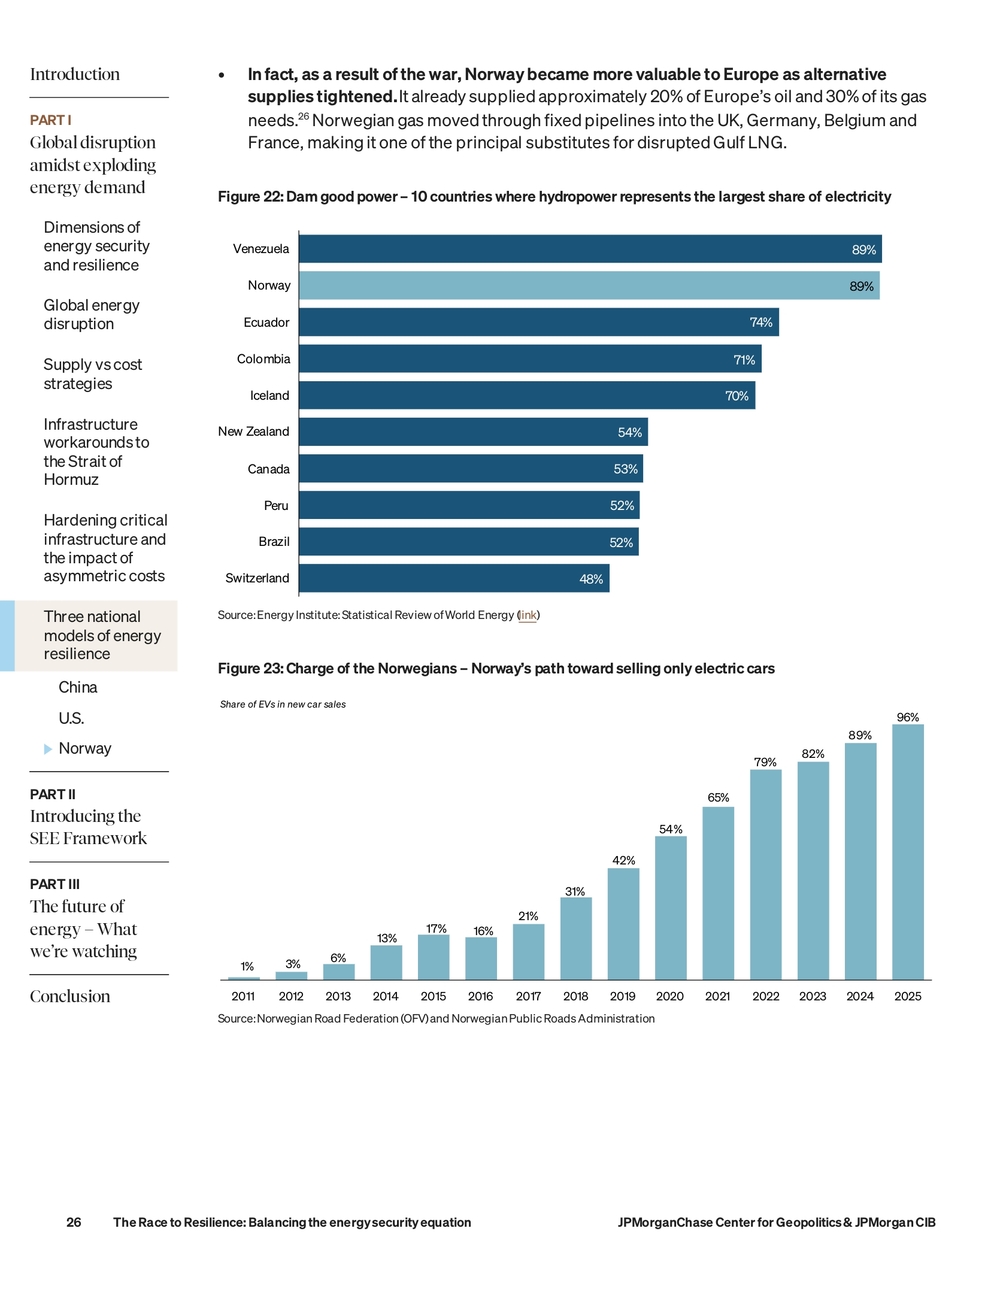
Introduction PART I Global disruption amidst exploding energy demand Dimensions of energy security and resilience Global energy disruption Supply vs cost strategies Infrastructure workarounds to the Strait of Hormuz Hardening critical infrastructure and the impact of asymmetric costs Three national models of energy resilience China U.S. Norway PART II Introducing the SEE Framework PART III The future of energy – What we’re watching Conclusion The Race to Resilience: Balancing the energy security equation JPMorganChase Center for Geopolitics & JPMorgan CIB 26• In fact, as a result of the war, Norway became more valuable to Europe as alternative supplies tightened. It already supplied approximately 20% of Europe’s oil and 30% of its gas needs.26 Norwegian gas moved through fixed pipelines into the UK, Germany, Belgium and France, making it one of the principal substitutes for disrupted Gulf LNG. Figure 22: Dam good power – 10 countries where hydropower represents the largest share of electricity 89% 89% 74% 71% 70% 54% 53% 52% 52% 48% Venezuela Norway Ecuador Colombia Iceland New Zealand Canada Peru Brazil Switzerland Source: Energy Institute: Statistical Review of World Energy ( link) Figure 23: Charge of the Norwegians – Norway’s path toward selling only electric cars 1% 3% 6% 13% 17% 16% 21% 31% 42% 54% 65% 79% 82% 89% 96% 2011 2012 2013 2014 2015 2016 2017 2018 2019 2020 2021 2022 2023 2024 2025 Share of EVs in new car sales Source: Norwegian Road Federation (OFV) and Norwegian Public Roads Administration
JPMorganChase Center for Geopolitics & JPMorgan CIB The Race to Resilience: Balancing the energy security equation27Part II How to build energy resilience: Introducing the SEE Framework As governments and companies race to strengthen energy resilience, a common pattern is emerging across markets. Whether responding to geopolitical shocks, rising electricity demand, or concerns about affordability, countries are increasingly pursuing the same three strategies to balance the energy-security equation of price, supply, and reliability . Based on these trends, we developed the SEE Framework —a simple way to understand how leading economies are adapting to the Energy Security Age. The framework rests on three pillars: • Supply Y our Own – Expanding access to domestically available energy resources (produced or stockpiled) while building related domestic manufacturing capacity. • Electrify – Reducing exposure to volatile fuel markets by shifting more economic activity from molecules to electrons, including electric vehicles, heat pumps, batteries, and industrial electrification. • Enhance Efficiency – Getting more economic output from every unit of energy consumed through grid modernization, demand management, and smarter use of electricity.
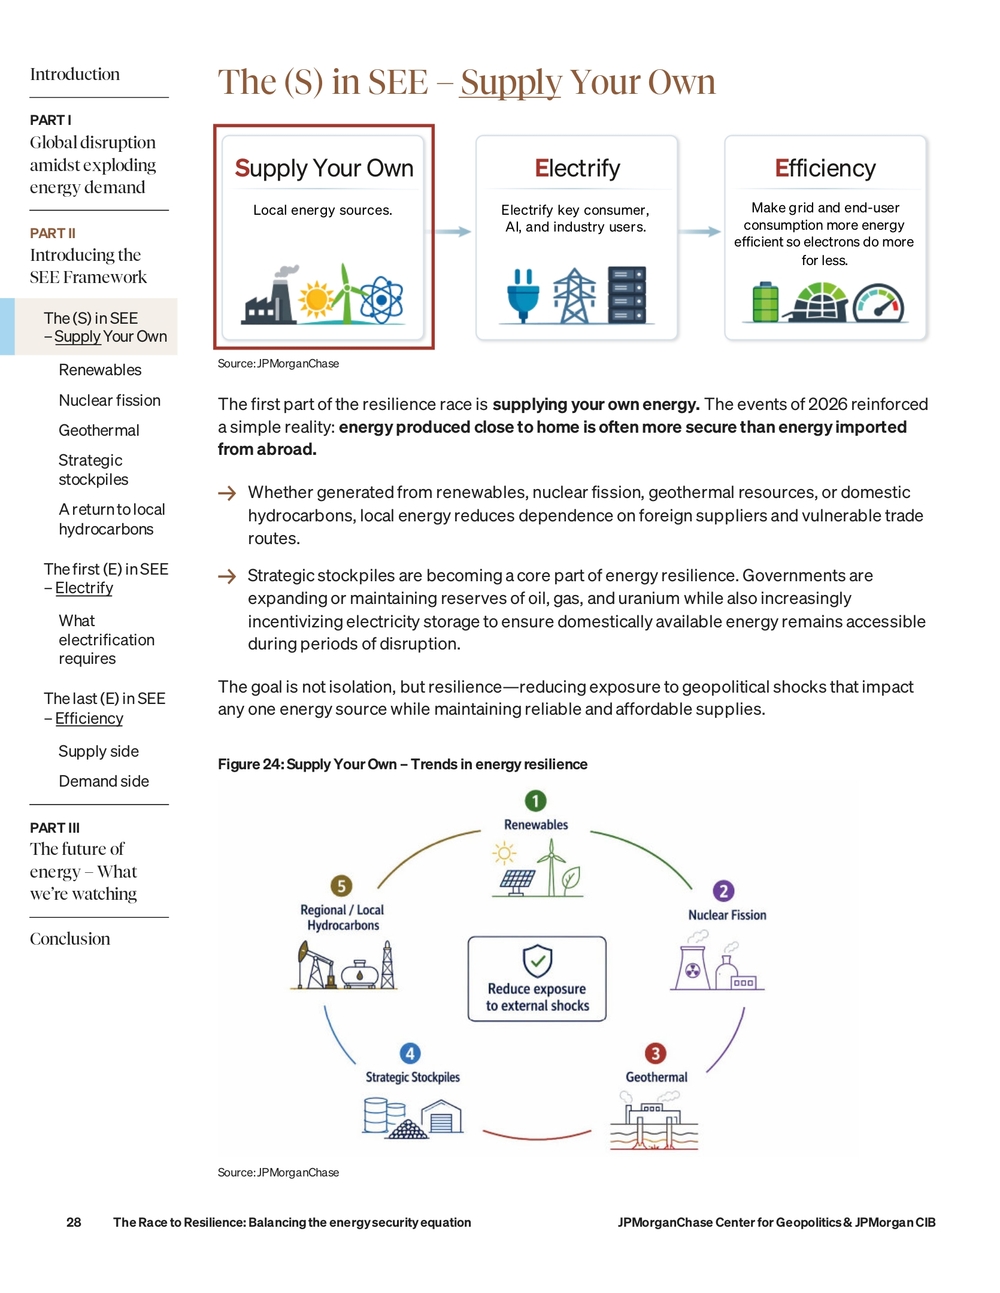
Introduction PART I Global disruption amidst exploding energy demand PART II Introducing the SEE Framework The (S) in SEE – Supply Your Own Renewables Nuclear fission Geothermal Strategic stockpiles A return to local hydrocarbons The first (E) in SEE – Electrify What electrification requires The last (E) in SEE – Efficiency Supply side Demand side PART III The future of energy – What we’re watching Conclusion The Race to Resilience: Balancing the energy security equation JPMorganChase Center for Geopolitics & JPMorgan CIB 28The (S) in SEE – Supply Your Own Local energy sources.Supply Your Own Electrify key consumer, AI, and industry users.Electrify Efficiency Make grid and end-user consumption more energy efficient so electrons do more for less. Source: JPMorganChase The first part of the resilience race is supplying your own energy. The events of 2026 reinforced a simple reality: energy produced close to home is often more secure than energy imported from abroad. → Whether generated from renewables, nuclear fission, geothermal resources, or domestic hydrocarbons, local energy reduces dependence on foreign suppliers and vulnerable trade routes. → Strategic stockpiles are becoming a core part of energy resilience. Governments are expanding or maintaining reserves of oil, gas, and uranium while also increasingly incentivizing electricity storage to ensure domestically available energy remains accessible during periods of disruption. The goal is not isolation, but resilience—reducing exposure to geopolitical shocks that impact any one energy source while maintaining reliable and affordable supplies. Figure 24: Supply Y our Own – Trends in energy resilience Source: JPMorganChase
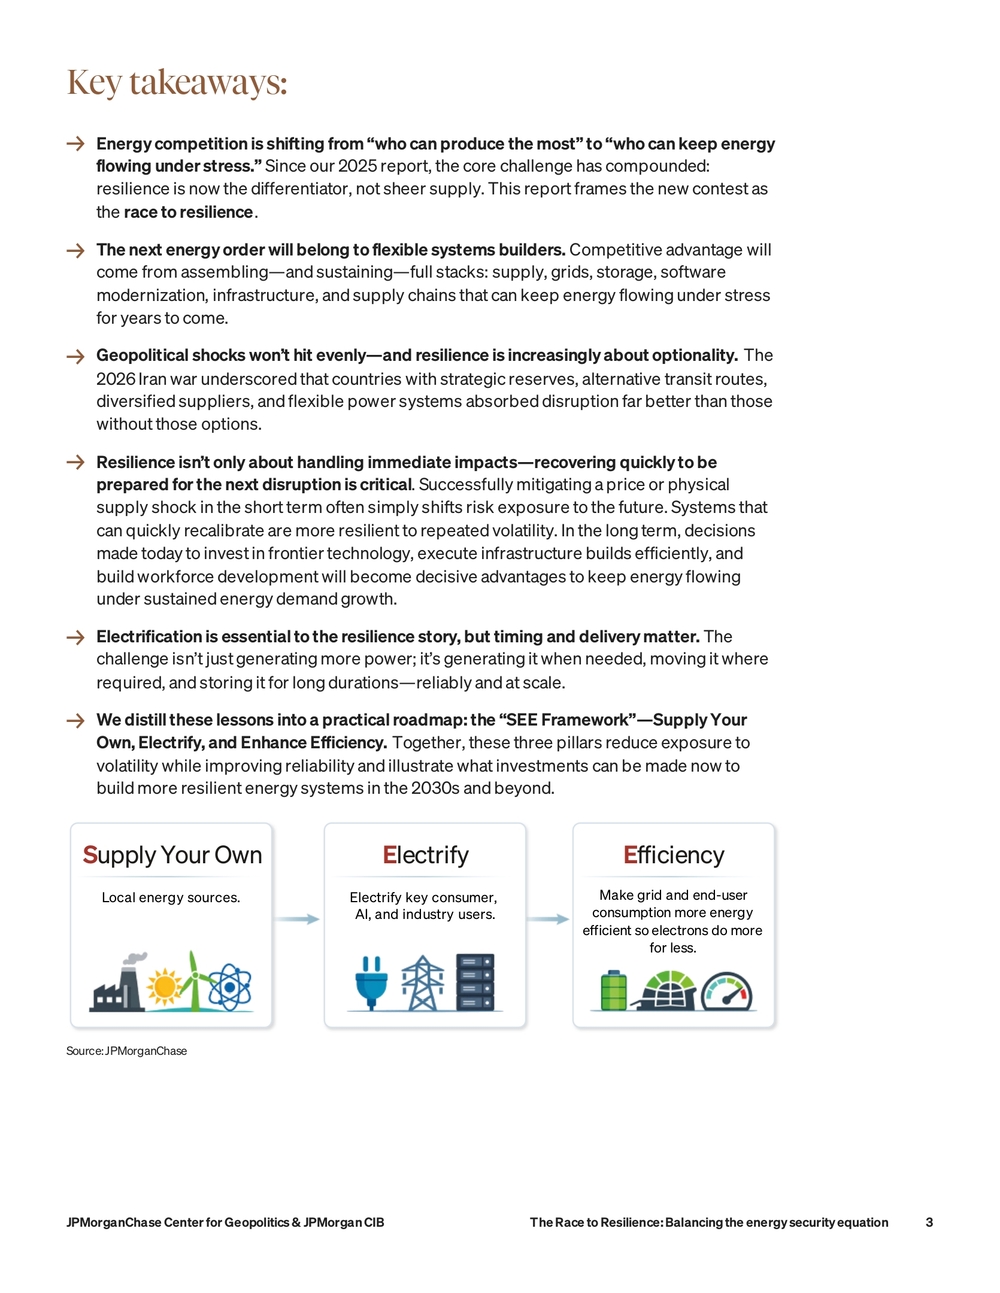
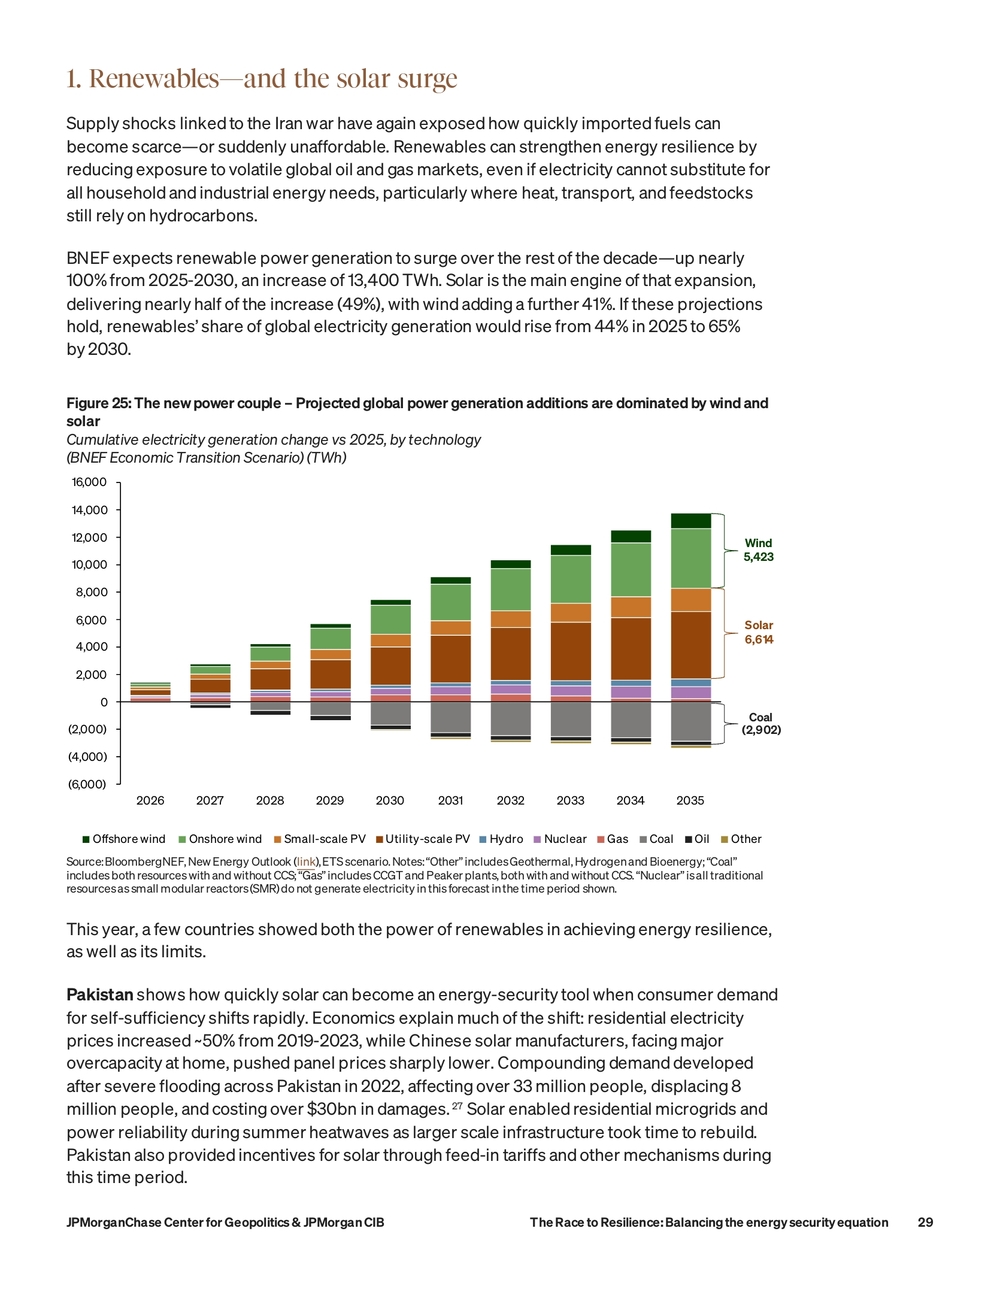
JPMorganChase Center for Geopolitics & JPMorgan CIB The Race to Resilience: Balancing the energy security equation291. Renewables—and the solar surge Supply shocks linked to the Iran war have again exposed how quickly imported fuels can become scarce—or suddenly unaffordable. Renewables can strengthen energy resilience by reducing exposure to volatile global oil and gas markets, even if electricity cannot substitute for all household and industrial energy needs, particularly where heat, transport, and feedstocks still rely on hydrocarbons. BNEF expects renewable power generation to surge over the rest of the decade—up nearly 100% from 2025-2030, an increase of 13,400 TWh. Solar is the main engine of that expansion, delivering nearly half of the increase (49%), with wind adding a further 41%. If these projections hold, renewables’ share of global electricity generation would rise from 44% in 2025 to 65% by 2030. Figure 25: The new power couple – Projected global power generation additions are dominated by wind and solar Cumulative electricity generation change vs 2025, by technology (BNEF Economic Transition Scenario) (TWh) (6,000) (4,000) (2,000) 0 2,000 4,000 6,000 8,000 10,000 12,000 14,000 16,000 2026 2027 2028 2029 2030 2031 2032 2033 2034 2035 Coal Gas Oil Nuclear Hydro Other Utility-scale PV Small-scale PV Onshore wind Offshore wind Wind 5,423 Solar 6,614 Coal (2,902) Source: BloombergNEF, New Energy Outlook ( link), ETS scenario. Notes: “Other” includes Geothermal, Hydrogen and Bioenergy; “Coal” includes both resources with and without CCS; “Gas” includes CCGT and Peaker plants, both with and without CCS. “Nuclear” is all traditional resources as small modular reactors (SMR) do not generate electricity in this forecast in the time period shown. This year, a few countries showed both the power of renewables in achieving energy resilience, as well as its limits. Pakistan shows how quickly solar can become an energy-security tool when consumer demand for self-sufficiency shifts rapidly. Economics explain much of the shift: residential electricity prices increased ~50% from 2019-2023, while Chinese solar manufacturers, facing major overcapacity at home, pushed panel prices sharply lower. Compounding demand developed after severe flooding across Pakistan in 2022, affecting over 33 million people, displacing 8 million people, and costing over $30bn in damages.27 Solar enabled residential microgrids and power reliability during summer heatwaves as larger scale infrastructure took time to rebuild. Pakistan also provided incentives for solar through feed-in tariffs and other mechanisms during this time period.
Introduction PART I Global disruption amidst exploding energy demand PART II Introducing the SEE Framework The (S) in SEE – Supply Your Own Renewables Nuclear fission Geothermal Strategic stockpiles A return to local hydrocarbons The first (E) in SEE – Electrify What electrification requires The last (E) in SEE – Efficiency Supply side Demand side PART III The future of energy – What we’re watching Conclusion The Race to Resilience: Balancing the energy security equation JPMorganChase Center for Geopolitics & JPMorgan CIB 30Figure 26: Price shock, solar rush – As residential electricity prices increased in Pakistan solar PV imports from China grew dramatically 755 1,222 1,362 1,590 2,199 3,202 7,594 16,385 $0.34 $0.32 $0.36 $0.49 $0.45 0 2,000 4,000 6,000 8,000 10,000 12,000 14,000 16,000 18,000 $0.00 $0.10 $0.20 $0.30 $0.40 $0.50 $0.60 2017 2018 2019 2020 2021 2022 2023 2024 USD/KWh Chinese solar panel imports (MW) - Right Axis Residential Electricity Prices (USD per KWh) - Left Axis MW Extreme Weather: Flood Source: OECD Data Explorer Green Growth Data Base ( link), Ember China Solar PV export data ( link); Note: U.S. dollars per kilowatt hour, PPP converted, 2020. Electricity price data available until 2024. 2025 panel import data for Pakistan grew to 16,860 MW Figure 27: Solar arbitrage – Pakistan’s recent electricity demand growth has been met entirely by distributed solar (Electricity generation, TWh) Demand and deployment had been growing pre-flood, but accelerated after. In learning how to live with floods and summer heatwaves disrupting energy delivery, consumers adopted self-sufficiency when alternatives were both available and affordable to avoid the alternative: expensive, unreliable, and/or unavailable utility electricity delivery. Extreme Weather: Flood 0 20 40 60 80 100 120 140 160 180 2015 2016 2017 2018 2019 2020 2021 2022 2023 2024 2025 Grid Distributed Solar Source: Ember ( link) Despite the rapid solar build-out, natural gas remained Pakistan’s Achilles’ heel (~28% of total energy supply per the IEA28). Large parts of the economy—from transit to heavy industry — cannot yet be easily electrified and depend on hydrocarbons.29 That left Pakistan highly exposed to Gulf supply: Qatar provided roughly 90% of its LNG, while Qatar and the UAE together accounted for about 99% of imports.30