Healthcare_Working Capital Index
by JPMorgan
Healthcare Working Capital Index J.P. Morgan Payments | Industry Advisory | Healthcare | 2025
Foreword The healthcare ecosystem comprises ofaninterconnected web ofstakeholders, including Pharmaceutical manufacturers, MedTech innovators, Providers, Distributors, and Payers .Allthesub-sectors within thehealthcare ecosystem face their own setofunique challenges and trends .For example, Health Plans need tomanage regulatory uncertainties, whereas Providers aremore focused onworkforce -related challenges .However, the overarching focus forallplayers remains growth andprofitability, while ensuring great healthcare forpatients . The Healthcare Working Capital Index report derives insights from working capital analysis of71leading companies across sub-sectors, analyzing working capital andcash conversion cycle trends forthelast10years .This report aids corporates inbenchmarking andenhancing their working capital performance relative toindustry peers, while providing guidance ontreasury optimization . Treasury and working capital management ismore critical than ever fortheindustry .The healthcare industry ishugely reliant oninnovation, R&D, technology and Artificial Intelligence (AI) and weareseeing more companies harness digital health innovations toaddress itschallenges and deliver patient -centered care.Such innovations demand substantial cash investments and supply chain structuring, underscoring theimportance ofstrategic treasury management, optimized liquidity solutions, innovative financing solutions and sustainable capital allocation. Companies that areable to optimize their treasury operations willnotonly beable toface thecurrent challenges butalso position themselves forfuture success inthedynamically evolving landscape . Mukund Iyengar Global Head of Healthcare and Public Sector Sales Managing Director, J.P. Morgan Payments “In the face of transformative shifts and systemic challenges, proactive and effective working capital management is the cornerstone of resilience and innovation in the healthcare sector. By optimizing treasury operations and embracing strategic investments, healthcare organizations can ensure financial stability, enhance patient care, and thrive amidst the complexities of an ever -changing industry.“ Note: 1CRO: Clinical Research Organization; 2MedTech: Medical TechnologyScope of this Report 71Companies Year Analysis (2015- 2024) Healthcare sub- sectors10 5 Life Sciences Pharmaceutical, biotech and CROs1 MedTech2 Medical device and diagnostics companies Providers Hospitals, clinics, and care delivery networks Distributors Wholesale and specialty drug distributors Payers Health insurers and managed care organizations
Table of Contents Executive Summary 1 Macro Themes 2 Sub-Sector Analysis Life Sciences 7 MedTech 9 Providers 11 Distributors 13 Payers 15 Working Capital Optimization Toolkit 17 Conclusion & Way Forward 18 Calculation Methodology 19
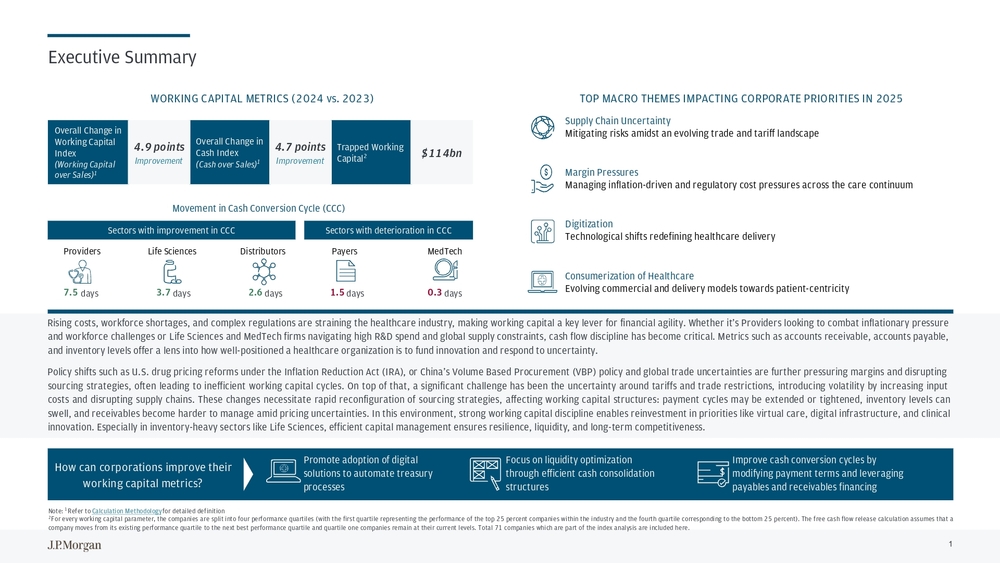
Overall Change in Working Capital Index (Working Capital over Sales)1Overall Change in Cash Index (Cash over Sales)1Executive Summary Rising costs, workforce shortages, andcomplex regulations arestraining thehealthcare industry, making working capital akeylever forfinancial agility .Whether it’sProviders looking tocombat inflationary pressure andworkforce challenges orLifeSciences andMedTech firms navigating high R&D spend andglobal supply constraints, cash flow discipline hasbecome critical .Metrics such asaccounts receivable, accounts payable, andinventory levels offer alens into how well-positioned ahealthcare organization istofund innovation andrespond touncertainty . Policy shifts such asU.S.drug pricing reforms under theInflation Reduction Act(IRA), orChina’s Volume Based Procurement (VBP) policy andglobal trade uncertainties arefurther pressuring margins anddisrupting sourcing strategies, often leading toinefficient working capital cycles .Ontopofthat, asignificant challenge hasbeen theuncertainty around tariffs and trade restrictions, introducing volatility byincreasing input costs and disrupting supply chains .These changes necessitate rapid reconfiguration ofsourcing strategies, affecting working capital structures: payment cycles may beextended ortightened, inventory levels can swell, andreceivables become harder tomanage amid pricing uncertainties .Inthisenvironment, strong working capital discipline enables reinvestment inpriorities likevirtual care, digital infrastructure, andclinical innovation. Especially ininventory -heavy sectors likeLifeSciences, efficient capital management ensures resilience, liquidity, andlong-term competitiveness .TOP MACRO THEMES IMPACTING CORPORATE PRIORITIES IN 2025 WORKING CAPITAL METRICS (2024 vs. 2023) Supply Chain Uncertainty Mitigating risks amidst an evolving trade and tariff landscape Margin Pressures Managing inflation- driven and regulatory cost pressures across the care continuum Consumerization of HealthcareEvolving commercial and delivery models towards patient -centricityDigitizationTechnological shifts redefining healthcare delivery Trapped Working Capital2 Note: 1Refer to Calculation Methodology for detailed definition 2For every working capital parameter, the companies are split into four performance quartiles (with the first quartile represe nting the performance of the top 25 percent companies within the industry and the fourth quartile corresponding to the bottom 25 percent). The free cash flow release calculation assumes that a company moves from its existing performance quartile to the next best performance quartile and quartile one companies remain at their current levels. Total 71 companies which are part of the index analysis are included here.4.9 points Improvement4.7 points Improvement$114bn 7.5 days 3.7days 2.6days 1.5days 0.3daysSectors with improvement in CCC Sectors with deterioration in CCC Providers Life Sciences Distributors Payers MedTechMovement in Cash Conversion Cycle (CCC) 1How can corporations improve their working capital metrics?Promote adoption of digital solutions to automate treasury processesFocus on liquidity optimization through efficient cash consolidation structuresImprove cash conversion cycles by modifying payment terms and leveraging payables and receivables financing
Macro themes

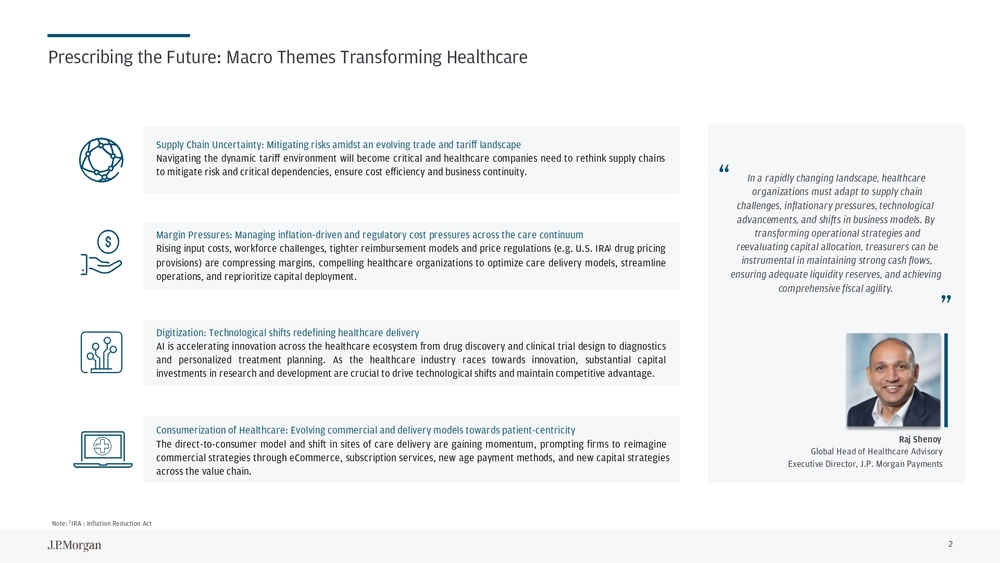
Prescribing the Future: Macro Themes Transforming Healthcare Supply Chain Uncertainty :Mitigating risks amidst anevolving trade andtariff landscape Navigating thedynamic tariff environment willbecome critical and healthcare companies need torethink supply chains tomitigate riskandcritical dependencies, ensure cost efficiency andbusiness continuity . Consumerization ofHealthcare :Evolving commercial anddelivery models towards patient -centricity The direct -to-consumer model and shift insites ofcare delivery aregaining momentum, prompting firms toreimagine commercial strategies through eCommerce, subscription services, new agepayment methods, and new capital strategies across thevalue chain. Note:1IRA : Inflation Reduction ActMargin Pressures :Managing inflation- driven andregulatory cost pressures across thecare continuum Rising input costs, workforce challenges ,tighter reimbursement models and price regulations (e.g.U.S.IRA1drug pricing provisions) arecompressing margins, compelling healthcare organizations tooptimize care delivery models, streamline operations, andreprioritize capital deployment . Digitization :Technological shifts redefining healthcare delivery AIisaccelerating innovation across thehealthcare ecosystem from drug discovery and clinical trial design todiagnostics and personalized treatment planning .Asthe healthcare industry races towards innovation, substantial capital investments inresearch anddevelopment arecrucial todrive technological shifts andmaintain competitive advantage . Raj Shenoy Global Head of Healthcare Advisory Executive Director, J.P. Morgan Payments“In a rapidly changing landscape, healthcare organizations must adapt to supply chain challenges, inflationary pressures, technological advancements, and shifts in business models. By transforming operational strategies and reevaluating capital allocation, treasurers can be instrumental in maintaining strong cash flows, ensuring adequate liquidity reserves, and achieving comprehensive fiscal agility.“ 2
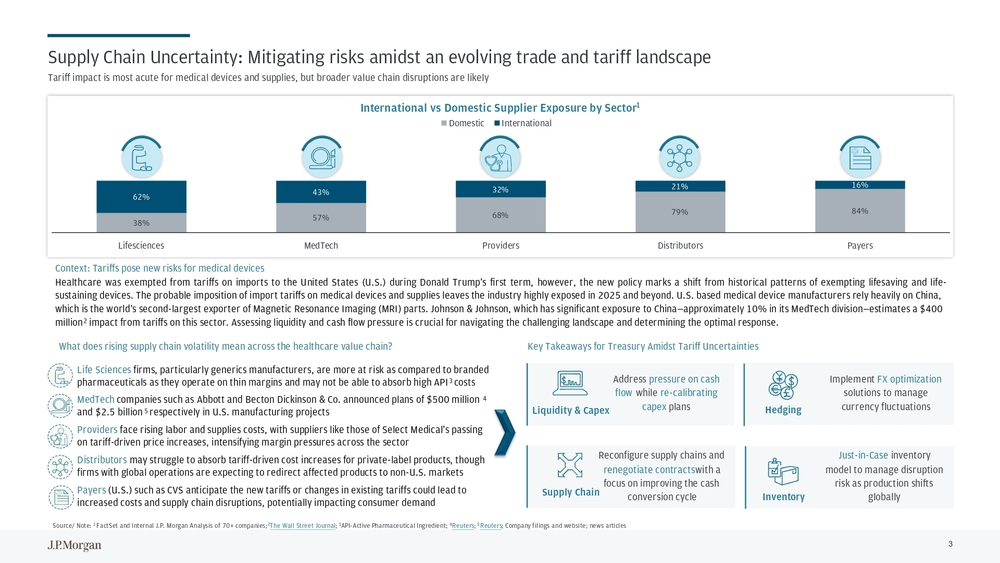
Supply Chain Uncertainty: Mitigating risks amidst an evolving trade and tariff landscape Context :Tariffs pose new risks formedical devices Healthcare was exempted from tariffs onimports totheUnited States (U.S.)during Donald Trump’s first term, however, thenew policy marks ashift from historical patterns ofexempting lifesaving and life- sustaining devices .Theprobable imposition ofimport tariffs onmedical devices andsupplies leaves theindustry highly exposed in2025 andbeyond .U.S.based medical device manufacturers rely heavily onChina, which istheworld’s second -largest exporter ofMagnetic Resonance Imaging (MRI) parts .Johnson &Johnson, which hassignificant exposure toChina —approximately 10% initsMedTech division —estimates a$400 million2impact from tariffs onthissector .Assessing liquidity andcash flow pressure iscrucial fornavigating thechallenging landscape anddetermining theoptimal response . Supply ChainReconfigure supply chains and renegotiate contracts with a focus on improving the cash conversion cycleHedgingImplement FX optimization solutions to manage currency fluctuations InventoryJust-in-Case inventory model to manage disruption risk as production shifts globally Liquidity & CapexAddress pressure on cash flow while re-calibrating capex plansKeyTakeaways forTreasury Amidst Tariff Uncertainties Life Sciences firms, particularly generics manufacturers, are more at risk as compared to branded pharmaceuticals as they operate on thin margins and may not be able to absorb high API3 costs MedTech companies such as Abbott and Becton Dickinson & Co. announced plans of $500 million4 and $2.5 billion5 respectively in U.S. manufacturing projects Providers face rising labor and supplies costs, with suppliers like those of Select Medical’s passing on tariff -driven price increases, intensifying margin pressures across the sector Distributors may struggle to absorb tariff -driven cost increases for private -label products, though firms with global operations are expecting to redirect affected products to non -U.S. markets Payers (U.S.) such as CVS anticipate the new tariffs or changes in existing tariffs could lead to increased costs and supply chain disruptions, potentially impacting consumer demandWhat does rising supply chain volatility mean across thehealthcare value chain?38%57%68%79% 84%62%43%32%21% 16% Lifesciences MedTech Providers Distributors PayersDomestic InternationalInternational vs Domestic Supplier Exposure by Sector1Tariff impact ismost acute formedical devices andsupplies, butbroader value chain disruptions arelikely Source/ Note: 1 FactSet and Internal J.P. Morgan Analysis of 70+ companies; 2The Wall Street Journal ; 3API-Active Pharmaceutical Ingredient; 4Reuters ; 5Reuters ;Company filings and website; news articles 3
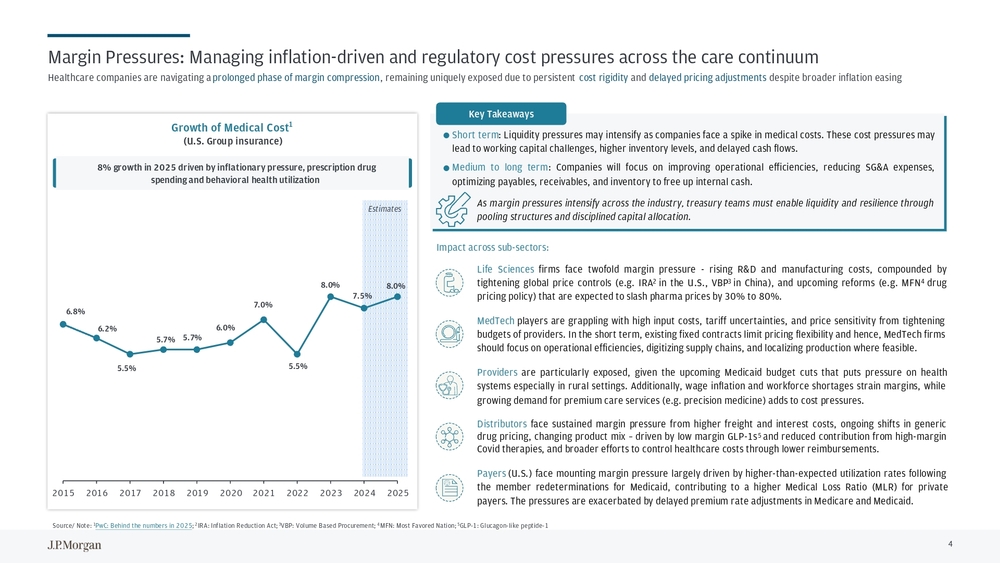
Margin Pressures: Managing inflation- driven and regulatory cost pressures across the care continuum Source/ Note:1PwC: Behind the numbers in 2025 ; 2IRA: Inflation Reduction Act; 3VBP: Volume Based Procurement; 4MFN: Most Favored Nation; 5GLP-1: Glucagon -like peptide- 1 Key Takeaways Life Sciences firms face twofold margin pressure -rising R&D and manufacturing costs, compounded by tightening global price controls (e.g.IRA2intheU.S.,VBP3inChina), and upcoming reforms (e.g.MFN4drug pricing policy) that areexpected toslash pharma prices by30% to80%. MedTech players aregrappling with high input costs, tariff uncertainties, and price sensitivity from tightening budgets ofproviders .Intheshort term, existing fixed contracts limit pricing flexibility andhence, MedTech firms should focus onoperational efficiencies, digitizing supply chains, andlocalizing production where feasible . Providers areparticularly exposed, given theupcoming Medicaid budget cuts that puts pressure onhealth systems especially inrural settings .Additionally, wage inflation and workforce shortages strain margins, while growing demand forpremium care services (e.g.precision medicine) adds tocost pressures . Distributors face sustained margin pressure from higher freight and interest costs, ongoing shifts ingeneric drug pricing, changing product mix–driven bylowmargin GLP-1s5and reduced contribution from high-margin Covid therapies, andbroader efforts tocontrol healthcare costs through lower reimbursements . Payers (U.S.)face mounting margin pressure largely driven byhigher -than -expected utilization rates following themember redeterminations forMedicaid, contributing toahigher Medical Loss Ratio (MLR) forprivate payers .Thepressures areexacerbated bydelayed premium rate adjustments inMedicare andMedicaid.Impact across sub-sectors:Short term :Liquidity pressures may intensify ascompanies face aspike inmedical costs. These cost pressures may lead toworking capital challenges, higher inventory levels, anddelayed cash flows . Medium tolong term :Companies will focus onimproving operational efficiencies, reducing SG&A expenses, optimizing payables, receivables, andinventory tofree upinternal cash . Asmargin pressures intensify across the industry, treasury teams must enable liquidity and resilience through pooling structures and disciplined capital allocation . 6.8% 6.2% 5.5%5.7% 5.7%6.0%7.0% 5.5%8.0% 7.5%8.0% 2015 2016 2017 2018 2019 2020 2021 2022 2023 2024 2025EstimatesGrowth of Medical Cost1 (U.S. Group insurance)Healthcare companies arenavigating aprolonged phase ofmargin compression ,remaining uniquely exposed duetopersistent cost rigidity anddelayed pricing adjustments despite broader inflation easing 8% growth in 2025 driven by inflationary pressure, prescription drug spending and behavioral health utilization 4
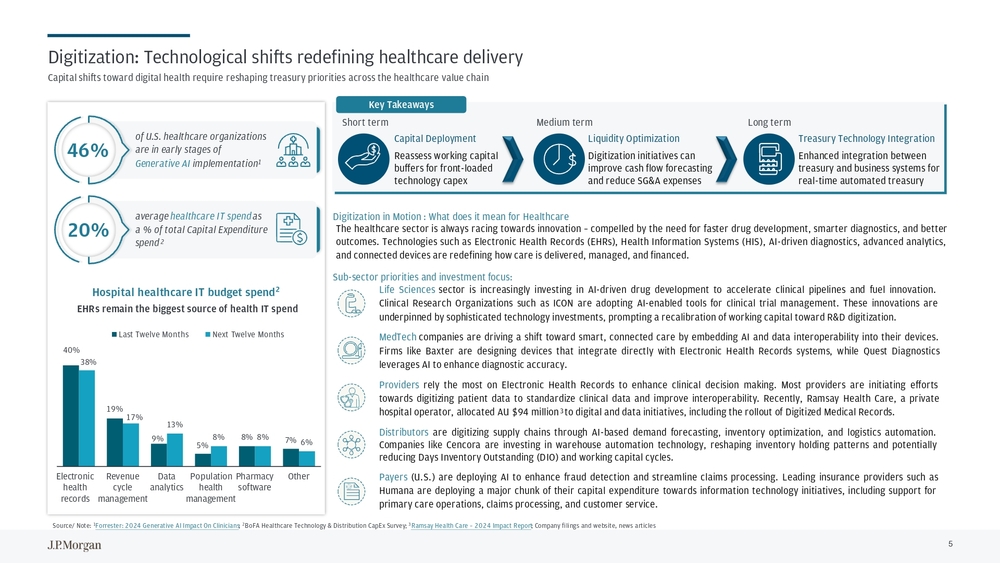
Digitization: Technological shifts redefining healthcare delivery Life Sciences sector isincreasingly investing inAI-driven drug development toaccelerate clinical pipelines and fuel innovation. Clinical Research Organizations such asICON areadopting AI-enabled tools forclinical trial management .These innovations are underpinned bysophisticated technology investments, prompting arecalibration ofworking capital toward R&D digitization . MedTech companies aredriving ashift toward smart, connected care byembedding AIand data interoperability into their devices . Firms like Baxter aredesigning devices that integrate directly with Electronic Health Records systems, while Quest Diagnostics leverages AItoenhance diagnostic accuracy . Providers rely themost onElectronic Health Records toenhance clinical decision making .Most providers areinitiating efforts towards digitizing patient data tostandardize clinical data and improve interoperability .Recently, Ramsay Health Care, aprivate hospital operator, allocated AU$94 million3todigital anddata initiatives, including therollout ofDigitized Medical Records. Distributors aredigitizing supply chains through AI-based demand forecasting, inventory optimization, and logistics automation . Companies like Cencora areinvesting inwarehouse automation technology, reshaping inventory holding patterns and potentially reducing Days Inventory Outstanding (DIO) andworking capital cycles . Payers (U.S.)aredeploying AItoenhance fraud detection and streamline claims processing .Leading insurance providers such as Humana aredeploying amajor chunk oftheir capital expenditure towards information technology initiatives, including support for primary care operations, claims processing, andcustomer service . Short term Medium term Long term Capital Deployment Reassess working capital buffers for front -loaded technology capexLiquidity Optimization Digitization initiatives can improve cash flow forecasting and reduce SG&A expensesTreasury Technology Integration Enhanced integration between treasury and business systems for real-time automated treasury Sub-sector priorities andinvestment focus:Thehealthcare sector isalways racing towards innovation –compelled bytheneed forfaster drug development, smarter diagnostics, and better outcomes. Technologies such asElectronic Health Records (EHRs), Health Information Systems (HIS), AI-driven diagnostics, advanced analytics, andconnected devices areredefining how care isdelivered, managed, andfinanced . 40% 19% 9%5%8% 7%38% 17% 13% 8% 8%6% Electronic health recordsRevenue cycle managementData analyticsPopulation health managementPharmacy softwareOtherLast Twelve Months Next Twelve MonthsDigitization inMotion :What does itmean forHealthcare of U.S. healthcare organizations are in early stages of Generative AI implementation1 46% average healthcare IT spend as a % of total Capital Expenditure spend 2 20% Hospital healthcare IT budget spend2 EHRs remain the biggest source of health IT spendCapital shifts toward digital health require reshaping treasury priorities across thehealthcare value chain Key Takeaways Source/ Note: 1Forrester: 2024 Generative AI Impact On Clinicians ; 2BoFA Healthcare Technology & Distribution CapEx Survey; 3Ramsay Health Care –2024 Impact Report; Company filings and website, news articles 5
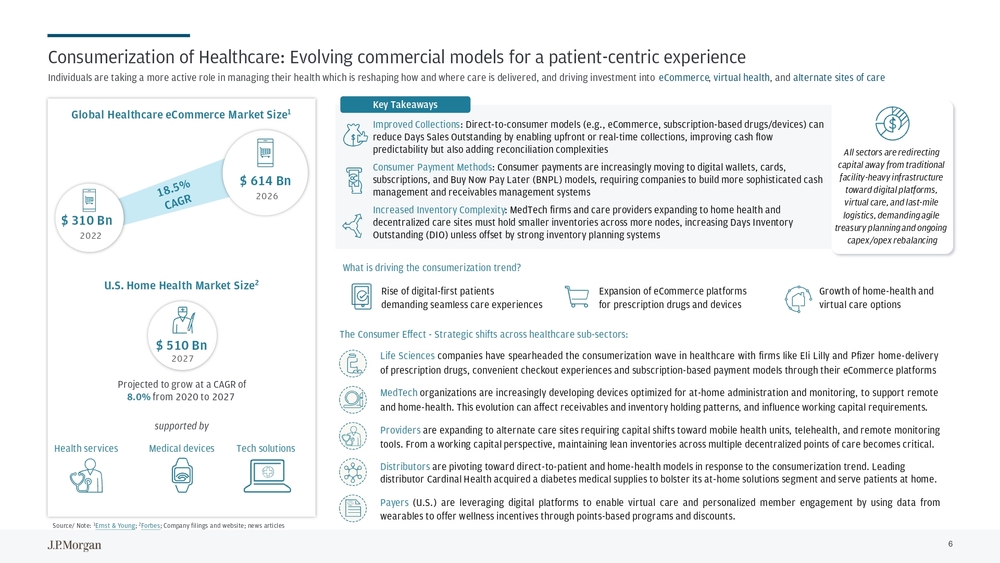
Consumerization of Healthcare: Evolving commercial models for a patient -centric experience Life Sciences companies have spearheaded theconsumerization wave inhealthcare with firms likeEliLilly and Pfizer home -delivery ofprescription drugs, convenient checkout experiences andsubscription -based payment models through their eCommerce platforms MedTech organizations areincreasingly developing devices optimized forat-home administration and monitoring, tosupport remote andhome -health. This evolution canaffect receivables andinventory holding patterns, andinfluence working capital requirements . Providers areexpanding toalternate care sites requiring capital shifts toward mobile health units, telehealth, andremote monitoring tools. From aworking capital perspective, maintaining lean inventories across multiple decentralized points ofcare becomes critical . Distributors are pivoting toward direct -to-patient and home -health models in response to the consumerization trend. Leading distributor Cardinal Health acquired a diabetes medical supplies to bolster its at -home solutions segment and serve patients at home. Payers (U.S.)areleveraging digital platforms toenable virtual care and personalized member engagement byusing data from wearables tooffer wellness incentives through points -based programs anddiscounts.TheConsumer Effect -Strategic shifts across healthcare sub-sectors:Improved Collections : Direct -to-consumer models (e.g., eCommerce, subscription -based drugs/devices) can reduce Days Sales Outstanding by enabling upfront or real -time collections, improving cash flow predictability but also adding reconciliation complexities Consumer Payment Methods : Consumer payments are increasingly moving to digital wallets, cards, subscriptions, and Buy Now Pay Later (BNPL) models, requiring companies to build more sophisticated cash management and receivables management systems Increased Inventory Complexity : MedTech firms and care providers expanding to home health and decentralized care sites must hold smaller inventories across more nodes, increasing Days Inventory Outstanding (DIO) unless offset by strong inventory planning systemsKey Takeaways U.S. Home Health Market Size2Individuals aretaking amore active role inmanaging their health which isreshaping how andwhere care isdelivered, anddriving investment into eCommerce ,virtual health, andalternate sites ofcare Rise of digital -first patients demanding seamless care experiencesWhat isdriving theconsumerization trend? Expansion of eCommerce platforms for prescription drugs and devicesGrowth of home -health and virtual care optionsGlobal Healthcare eCommerce Market Size1 All sectors are redirecting capital away from traditional facility -heavy infrastructure toward digital platforms, virtual care, and last -mile logistics, demanding agile treasury planning and ongoing capex/opex rebalancing $ 310 Bn2026$ 614 Bn 2022 Projected to grow at a CAGR of 8.0% from 2020 to 2027 $ 510 Bn 2027 Health services Medical devices Tech solutionssupported by Source/ Note: 1Ernst & Young ; 2Forbes ; Company filings and website; news articles 6
Sub-Sector Analysis

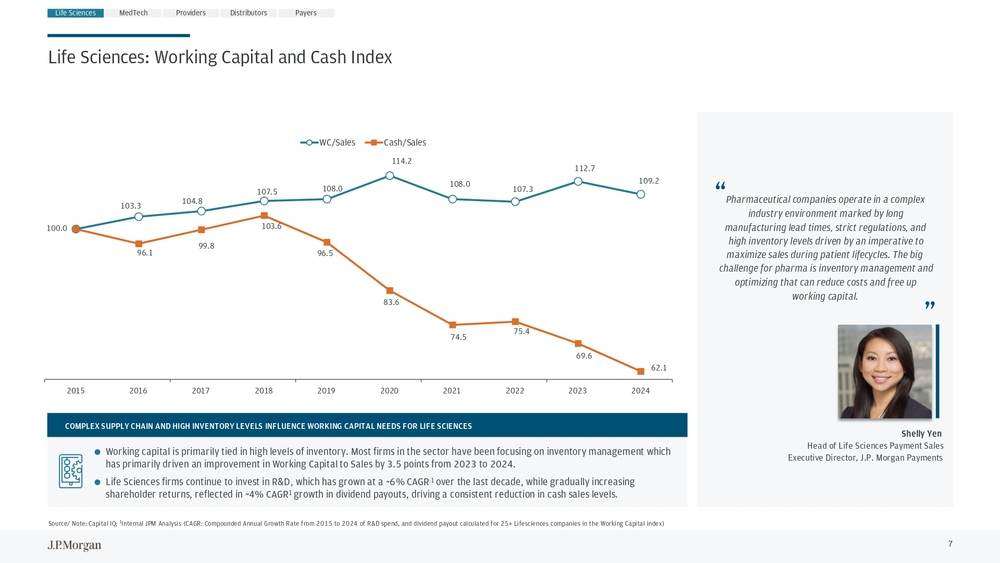
Life Sciences: Working Capital and Cash Index 100.0 103.3 104.8 107.5 108.0 114.2 108.0 107.3 112.7 109.2 96.1 99.8 103.6 96.5 83.6 74.5 75.4 69.6 62.1 2015 2016 2017 2018 2019 2020 2021 2022 2023 2024WC/Sales Cash/Sales “Pharmaceutical companies operate in a complex industry environment marked by long manufacturing lead times, strict regulations, and high inventory levels driven by an imperative to maximize sales during patient lifecycles. The big challenge for pharma is inventory management and optimizing that can reduce costs and free up working capital.“ Life Sciences MedTech Providers Distributors Payers Shelly Yen Head of Life Sciences Payment Sales Executive Director, J.P. Morgan PaymentsCOMPLEX SUPPLY CHAIN AND HIGH INVENTORY LEVELS INFLUENCE WORKING CAPITAL NEEDS FOR LIFE SCIENCES Working capital is primarily tied in high levels of inventory. Most firms in the sector have been focusing on inventory manageme nt which has primarily driven an improvement in Working Capital to Sales by 3.5 points from 2023 to 2024. Life Sciences firms continue to invest in R&D, which has grown at a ~6% CAGR1 over the last decade, while gradually increasing shareholder returns, reflected in ~4% CAGR1 growth in dividend payouts, driving a consistent reduction in cash sales levels. Source/ Note: Capital IQ; 1Internal JPM Analysis (CAGR: Compounded Annual Growth Rate from 2015 to 2024 of R&D spend, and dividend payout calculated for 25+ Lifesciences companies in the Working Capital index) 7
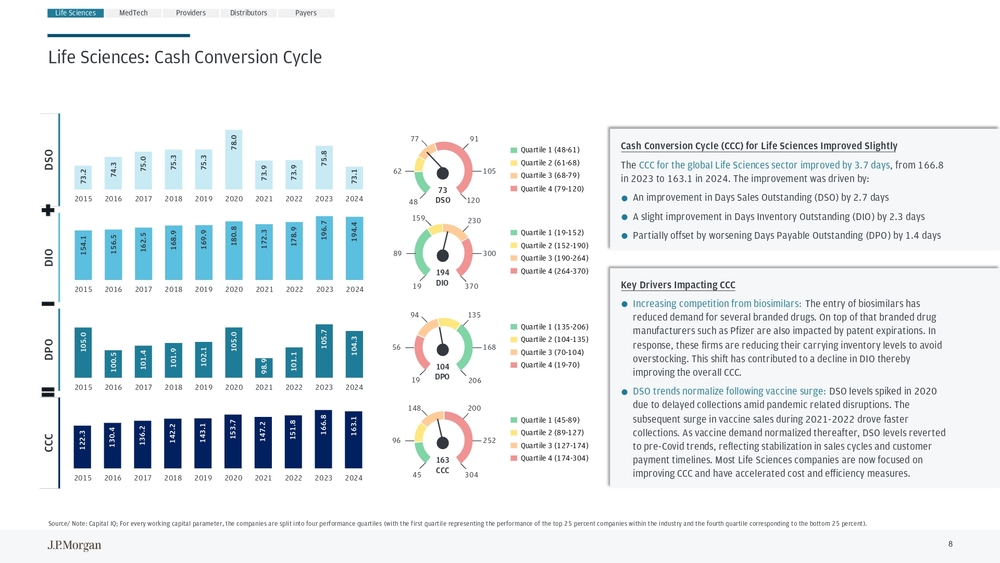
Life Sciences: Cash Conversion Cycle 73.2 74.3 75.0 75.3 75.3 78.0 73.9 73.9 75.8 73.1 2015 2016 2017 2018 2019 2020 2021 2022 2023 2024105.0 100.5 101.4 101.9 102.1 105.0 98.9 101.1 105.7 104.3 2015 2016 2017 2018 2019 2020 2021 2022 2023 2024154.1 156.5 162.5 168.9 169.9 180.8 172.3 178.9 196.7 194.4 2015 2016 2017 2018 2019 2020 2021 2022 2023 2024122.3 130.4 136.2 142.2 143.1 153.7 147.2 151.8 166.8 163.1 2015 2016 2017 2018 2019 2020 2021 2022 2023 2024DSO DIO DPO CCC Cash Conversion Cycle (CCC) for Life Sciences Improved Slightly The CCC for the global Life Sciences sector improved by 3.7 days , from 166.8 in 2023 to 163.1 in 2024. The improvement was driven by: An improvement in Days Sales Outstanding (DSO) by 2.7 days A slight improvement in Days Inventory Outstanding (DIO) by 2.3 days Partially offset by worsening Days Payable Outstanding (DPO) by 1.4 daysQuartile 1 (48- 61) Quartile 2 (61- 68) Quartile 3 (68- 79) Quartile 4 (79- 120) 73 DSO77 91 105 120 4862 Quartile 1 (19- 152) Quartile 2 (152- 190) Quartile 3 (190- 264) Quartile 4 (264- 370) 194 DIO159230 300 370 1989 Quartile 1 (135- 206) Quartile 2 (104- 135) Quartile 3 (70- 104) Quartile 4 (19- 70) 104 DPO94 135 168 206 19 Quartile 1 (45- 89) Quartile 2 (89- 127) Quartile 3 (127- 174) Quartile 4 (174- 304) 163 CCC148 200 252 304 459656Life Sciences MedTech Providers Source/ Note: Capital IQ; For every working capital parameter, the companies are split into four performance quartiles (with thefirst quartile representing the performance of the top 25 percent companies within the industry and the fourth quartile corre sponding to the bottom 25 percent). Key Drivers Impacting CCC Increasing competition from biosimilars: The entry of biosimilars has reduced demand for several branded drugs. On top of that branded drug manufacturers such as Pfizer are also impacted by patent expirations. In response, these firms are reducing their carrying inventory levels to avoid overstocking. This shift has contributed to a decline in DIO thereby improving the overall CCC. DSO trends normalize following vaccine surge: DSO levels spiked in 2020 due to delayed collections amid pandemic related disruptions. The subsequent surge in vaccine sales during 2021- 2022 drove faster collections. As vaccine demand normalized thereafter, DSO levels reverted to pre -Covid trends, reflecting stabilization in sales cycles and customer payment timelines. Most Life Sciences companies are now focused on improving CCC and have accelerated cost and efficiency measures.Distributors Payers 8
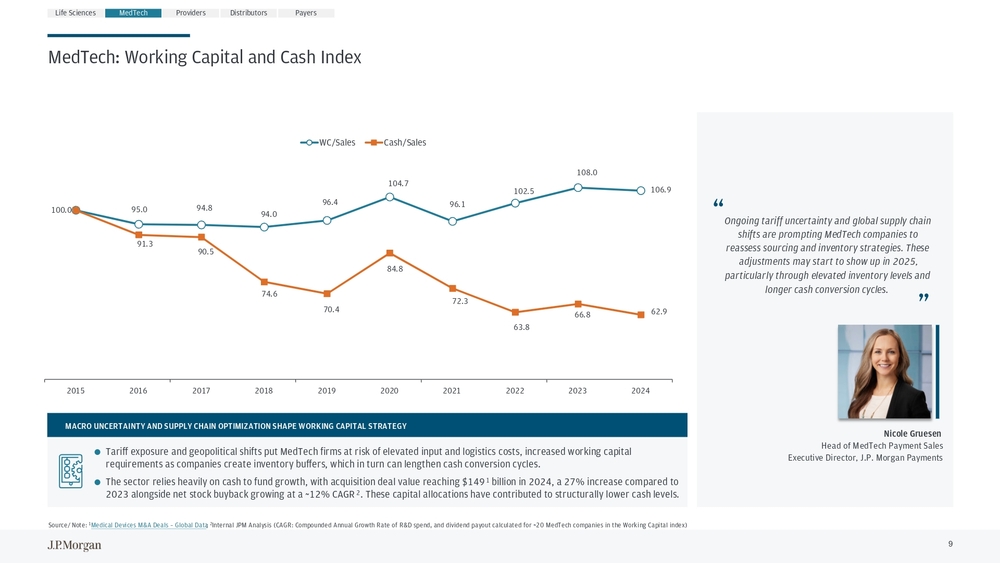
MedTech: Working Capital and Cash Index 100.0 95.0 94.8 94.0 96.4 104.7 96.1 102.5 108.0 106.9 91.3 90.5 74.6 70.4 84.8 72.3 63.8 66.8 62.9 2015 2016 2017 2018 2019 2020 2021 2022 2023 2024WC/Sales Cash/SalesLife Sciences MedTech Providers “Ongoing tariff uncertainty and global supply chain shifts are prompting MedTech companies to reassess sourcing and inventory strategies. These adjustments may start to show up in 2025, particularly through elevated inventory levels and longer cash conversion cycles.“Distributors Payers Nicole Gruesen Head of MedTech Payment Sales Executive Director, J.P. Morgan PaymentsMACRO UNCERTAINTY AND SUPPLY CHAIN OPTIMIZATION SHAPE WORKING CA PITAL STRATEGY Tariff exposure and geopolitical shifts put MedTech firms at risk of elevated input and logistics costs, increased working ca pital requirements as companies create inventory buffers, which in turn can lengthen cash conversion cycles. The sector relies heavily on cash to fund growth, with acquisition deal value reaching $1491 billion in 2024, a 27% increase compared to 2023 alongside net stock buyback growing at a ~12% CAGR2. These capital allocations have contributed to structurally lower cash levels. Source/ Note: 1Medical Devices M&A Deals –Global Data; 2Internal JPM Analysis (CAGR: Compounded Annual Growth Rate of R&D spend, and dividend payout calculated for ~20 MedTech compa nies in the Working Capital index) 9
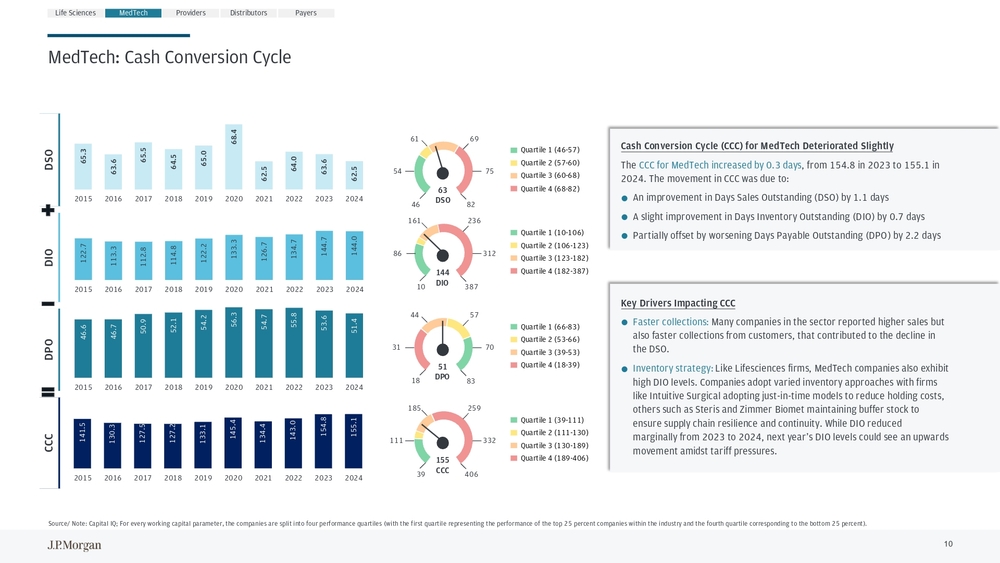
MedTech: Cash Conversion Cycle 65.3 63.6 65.5 64.5 65.0 68.4 62.5 64.0 63.6 62.5 2015 2016 2017 2018 2019 2020 2021 2022 2023 202446.6 46.7 50.9 52.1 54.2 56.3 54.7 55.8 53.6 51.4 2015 2016 2017 2018 2019 2020 2021 2022 2023 2024122.7 113.3 112.8 114.8 122.2 133.3 126.7 134.7 144.7 144.0 2015 2016 2017 2018 2019 2020 2021 2022 2023 2024141.5 130.3 127.5 127.2 133.1 145.4 134.4 143.0 154.8 155.1 2015 2016 2017 2018 2019 2020 2021 2022 2023 2024Quartile 1 (46- 57) Quartile 2 (57- 60) Quartile 3 (60- 68) Quartile 4 (68- 82) Quartile 1 (10- 106) Quartile 2 (106- 123) Quartile 3 (123- 182) Quartile 4 (182- 387) Quartile 1 (66- 83) Quartile 2 (53- 66) Quartile 3 (39- 53) Quartile 4 (18- 39) Quartile 1 (39- 111) Quartile 2 (111- 130) Quartile 3 (130- 189) Quartile 4 (189- 406)63 DSO61 69 75 82 4654 144 DIO161 236 312 387 1086 51 DPO44 57 70 83 18 155 CCC185 259 332 406 3911131Life Sciences MedTech ProvidersDSO DIO DPO CCC Source/ Note: Capital IQ; For every working capital parameter, the companies are split into four performance quartiles (with thefirst quartile representing the performance of the top 25 percent companies within the industry and the fourth quartile corre sponding to the bottom 25 percent). Key Drivers Impacting CCC Faster collections: Many companies in the sector reported higher sales but also faster collections from customers, that contributed to the decline in the DSO. Inventory strategy: Like Lifesciences firms, MedTech companies also exhibit high DIO levels. Companies adopt varied inventory approaches with firms like Intuitive Surgical adopting just -in-time models to reduce holding costs, others such as Steris and Zimmer Biomet maintaining buffer stock to ensure supply chain resilience and continuity. While DIO reduced marginally from 2023 to 2024, next year’s DIO levels could see an upwards movement amidst tariff pressures. Cash Conversion Cycle (CCC) for MedTech Deteriorated Slightly The CCC for MedTech increased by 0.3 days , from 154.8 in 2023 to 155.1 in 2024. The movement in CCC was due to: An improvement in Days Sales Outstanding (DSO) by 1.1 days A slight improvement in Days Inventory Outstanding (DIO) by 0.7 days Partially offset by worsening Days Payable Outstanding (DPO) by 2.2 daysDistributors Payers 10
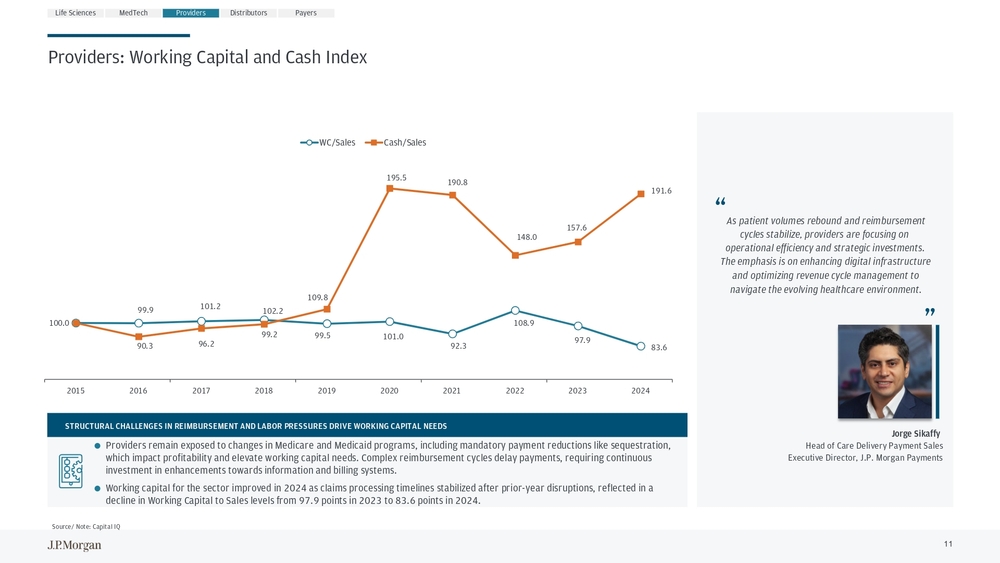
Providers: Working Capital and Cash Index 100.0 99.9 101.2 102.2 99.5 101.0 92.3 108.9 97.9 83.6 90.3 96.2 99.2 109.8 195.5 190.8 148.0 157.6 191.6 2015 2016 2017 2018 2019 2020 2021 2022 2023 2024WC/Sales Cash/SalesLife Sciences MedTech Providers “As patient volumes rebound and reimbursement cycles stabilize, providers are focusing on operational efficiency and strategic investments. The emphasis is on enhancing digital infrastructure and optimizing revenue cycle management to navigate the evolving healthcare environment. “Distributors Payers Jorge Sikaffy Head of Care Delivery Payment Sales Executive Director, J.P. Morgan PaymentsSTRUCTURAL CHALLENGES IN REIMBURSEMENT AND LABOR PRESSURES DRIVE WORKING CAPITAL NEEDS Providers remain exposed to changes in Medicare and Medicaid programs, including mandatory payment reductions like sequestrat ion, which impact profitability and elevate working capital needs. Complex reimbursement cycles delay payments, requiring continuo us investment in enhancements towards information and billing systems. Working capital for the sector improved in 2024 as claims processing timelines stabilized after prior -year disruptions, reflected in a decline in Working Capital to Sales levels from 97.9 points in 2023 to 83.6 points in 2024. Source/ Note: Capital IQ 11
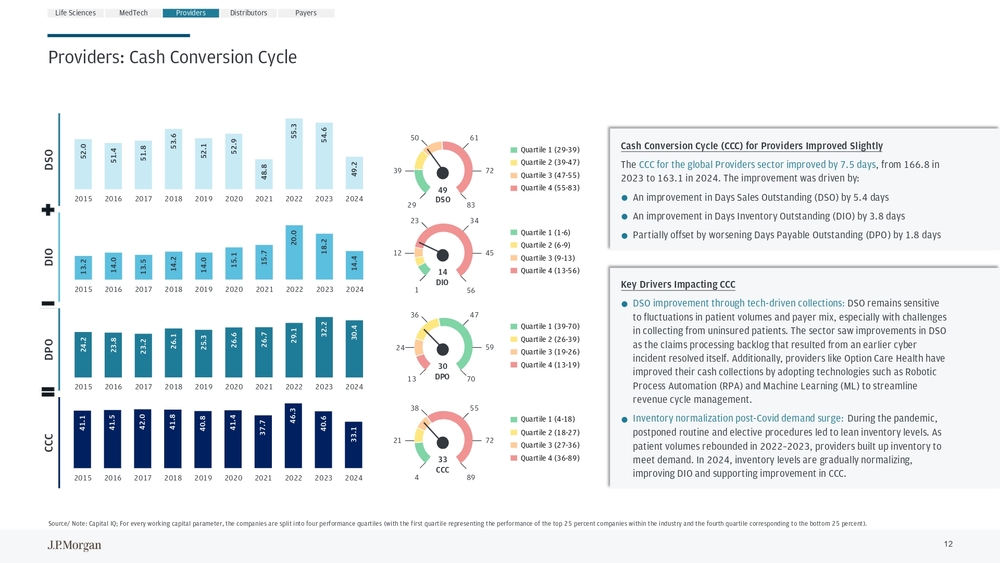
Providers: Cash Conversion Cycle 52.0 51.4 51.8 53.6 52.1 52.9 48.8 55.3 54.6 49.2 2015 2016 2017 2018 2019 2020 2021 2022 2023 202424.2 23.8 23.2 26.1 25.3 26.6 26.7 29.1 32.2 30.4 2015 2016 2017 2018 2019 2020 2021 2022 2023 202413.2 14.0 13.5 14.2 14.0 15.1 15.7 20.0 18.2 14.4 2015 2016 2017 2018 2019 2020 2021 2022 2023 202441.1 41.5 42.0 41.8 40.8 41.4 37.7 46.3 40.6 33.1 2015 2016 2017 2018 2019 2020 2021 2022 2023 2024Quartile 1 (29- 39) Quartile 2 (39- 47) Quartile 3 (47- 55) Quartile 4 (55- 83) 49 DSO50 61 72 83 2939 Quartile 1 (1- 6) Quartile 2 (6- 9) Quartile 3 (9- 13) Quartile 4 (13- 56) 14 DIO23 34 45 56 112 Quartile 1 (39- 70) Quartile 2 (26- 39) Quartile 3 (19- 26) Quartile 4 (13- 19) 30 DPO36 47 59 70 13 Quartile 1 (4- 18) Quartile 2 (18- 27) Quartile 3 (27- 36) Quartile 4 (36- 89) 33 CCC38 55 72 89 42124Life Sciences MedTech ProvidersDSO DIO DPO CCC Source/ Note: Capital IQ; For every working capital parameter, the companies are split into four performance quartiles (with thefirst quartile representing the performance of the top 25 percent companies within the industry and the fourth quartile corre sponding to the bottom 25 percent). Key Drivers Impacting CCC DSO improvement through tech -driven collections: DSO remains sensitive to fluctuations in patient volumes and payer mix, especially with challenges in collecting from uninsured patients. The sector saw improvements in DSO as the claims processing backlog that resulted from an earlier cyber incident resolved itself. Additionally, providers like Option Care Health have improved their cash collections by adopting technologies such as Robotic Process Automation (RPA) and Machine Learning (ML) to streamline revenue cycle management. Inventory normalization post -Covid demand surge: During the pandemic, postponed routine and elective procedures led to lean inventory levels. As patient volumes rebounded in 2022– 2023, providers built up inventory to meet demand. In 2024, inventory levels are gradually normalizing, improving DIO and supporting improvement in CCC. Cash Conversion Cycle (CCC) for Providers Improved Slightly The CCC for the global Providers sector improved by 7.5 days , from 166.8 in 2023 to 163.1 in 2024. The improvement was driven by: An improvement in Days Sales Outstanding (DSO) by 5.4 days An improvement in Days Inventory Outstanding (DIO) by 3.8 days Partially offset by worsening Days Payable Outstanding (DPO) by 1.8 daysDistributors Payers 12
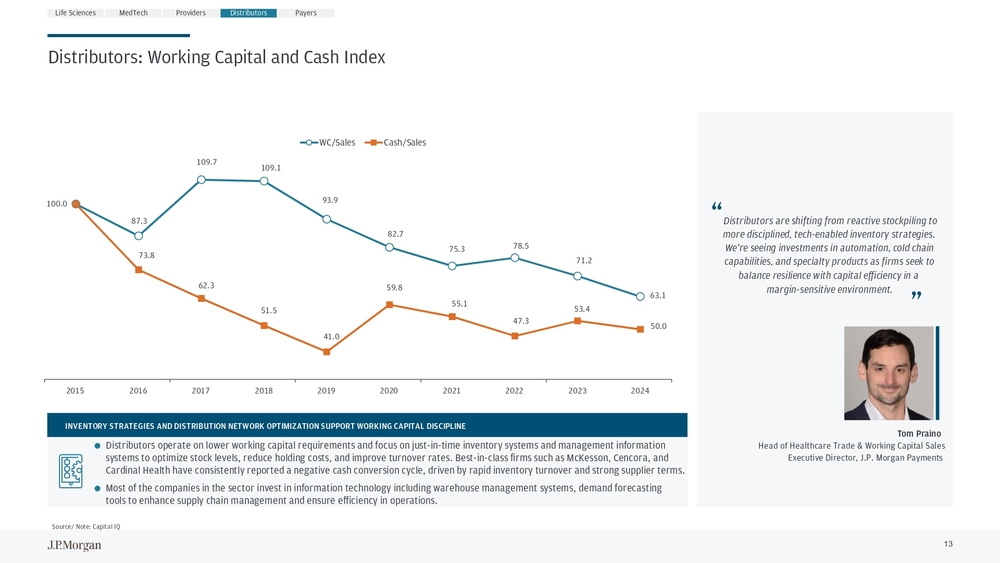
Distributors: Working Capital and Cash Index 100.0 87.3 109.7 109.1 93.9 82.7 75.3 78.5 71.2 63.1 73.8 62.3 51.5 41.0 59.8 55.1 47.3 53.4 50.0 2015 2016 2017 2018 2019 2020 2021 2022 2023 2024WC/Sales Cash/SalesLife Sciences MedTech Providers Distributors Payers “Distributors are shifting from reactive stockpiling to more disciplined, tech -enabled inventory strategies. We’re seeing investments in automation, cold chain capabilities, and specialty products as firms seek to balance resilience with capital efficiency in a margin -sensitive environment.“ Tom Praino Head of Healthcare Trade & Working Capital Sales Executive Director, J.P. Morgan PaymentsINVENTORY STRATEGIES AND DISTRIBUTION NETWORK OPTIMIZATION SUPPO RT WORKING CAPITAL DISCIPLINE Distributors operate on lower working capital requirements and focus on just -in-time inventory systems and management informatio n systems to optimize stock levels, reduce holding costs, and improve turnover rates. Best -in-class firms such as McKesson, Cencora , and Cardinal Health have consistently reported a negative cash conversion cycle, driven by rapid inventory turnover and strong suppl ier terms. Most of the companies in the sector invest in information technology including warehouse management systems, demand forecasting tools to enhance supply chain management and ensure efficiency in operations. Source/ Note: Capital IQ 13
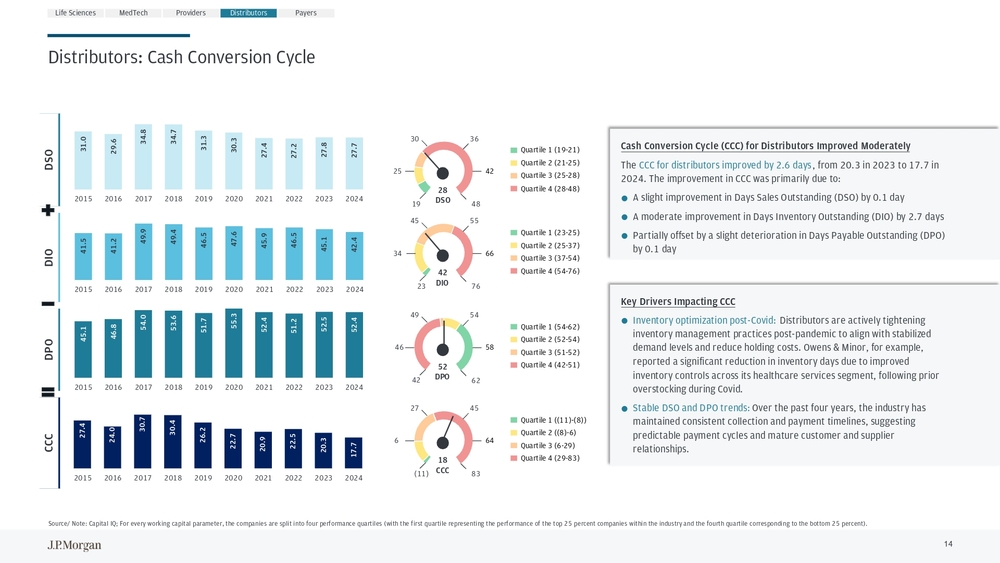
Distributors: Cash Conversion Cycle 31.0 29.6 34.8 34.7 31.3 30.3 27.4 27.2 27.8 27.7 2015 2016 2017 2018 2019 2020 2021 2022 2023 202445.1 46.8 54.0 53.6 51.7 55.3 52.4 51.2 52.5 52.4 2015 2016 2017 2018 2019 2020 2021 2022 2023 202441.5 41.2 49.9 49.4 46.5 47.6 45.9 46.5 45.1 42.4 2015 2016 2017 2018 2019 2020 2021 2022 2023 202427.4 24.0 30.7 30.4 26.2 22.7 20.9 22.5 20.3 17.7 2015 2016 2017 2018 2019 2020 2021 2022 2023 2024Quartile 1 (19- 21) Quartile 2 (21- 25) Quartile 3 (25- 28) Quartile 4 (28- 48) Quartile 1 (23- 25) Quartile 2 (25- 37) Quartile 3 (37- 54) Quartile 4 (54- 76) Quartile 1 (54- 62) Quartile 2 (52- 54) Quartile 3 (51- 52) Quartile 4 (42- 51) Quartile 1 ((11)- (8)) Quartile 2 ((8)- 6) Quartile 3 (6- 29) Quartile 4 (29- 83)28 DSO30 36 42 48 1925 42 DIO45 55 66 76 2334 52 DPO49 54 58 62 42 18 CCC27 45 64 83 (11)646Life Sciences MedTech ProvidersDSO DIO DPO CCC Source/ Note: Capital IQ; For every working capital parameter, the companies are split into four performance quartiles (with the first quartile represe nting the performance of the top 25 percent companies within the industry and the fourth quartile corresponding to the bottom 25 percent). Key Drivers Impacting CCC Inventory optimization post -Covid: Distributors are actively tightening inventory management practices post -pandemic to align with stabilized demand levels and reduce holding costs. Owens & Minor, for example, reported a significant reduction in inventory days due to improved inventory controls across its healthcare services segment, following prior overstocking during Covid. Stable DSO and DPO trends: Over the past four years, the industry has maintained consistent collection and payment timelines, suggesting predictable payment cycles and mature customer and supplier relationships. Cash Conversion Cycle (CCC) for Distributors Improved Moderately The CCC for distributors improved by 2.6 days , from 20.3 in 2023 to 17.7 in 2024. The improvement in CCC was primarily due to: A slight improvement in Days Sales Outstanding (DSO) by 0.1 day A moderate improvement in Days Inventory Outstanding (DIO) by 2.7 days Partially offset by a slight deterioration in Days Payable Outstanding (DPO) by 0.1 dayDistributors Payers 14
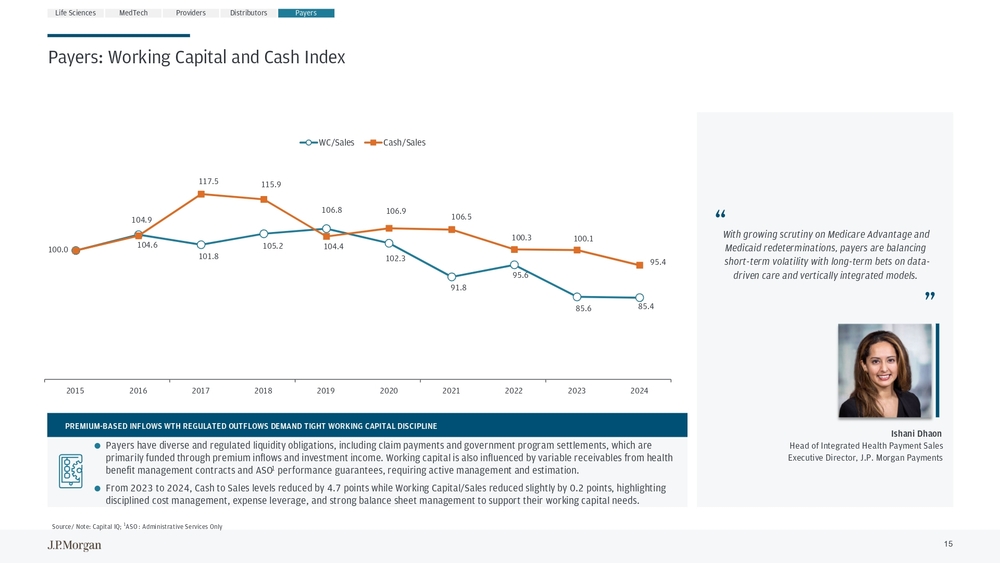
Payers: Working Capital and Cash Index 100.0 104.9 101.8 105.2 106.8 102.3 91.8 95.6 85.6 85.4 104.6 117.5 115.9 104.4 106.9 106.5 100.3 100.1 95.4 2015 2016 2017 2018 2019 2020 2021 2022 2023 2024WC/Sales Cash/SalesLife Sciences MedTech Providers Distributors Payers “With growing scrutiny on Medicare Advantage and Medicaid redeterminations, payers are balancing short -term volatility with long -term bets on data - driven care and vertically integrated models. “ Ishani Dhaon Head of Integrated Health Payment Sales Executive Director, J.P. Morgan PaymentsPREMIUM- BASED INFLOWS WTH REGULATED OUTFLOWS DEMAND TIGHT WORKIN G CAPITAL DISCIPLINE Payers have diverse and regulated liquidity obligations, including claim payments and government program settlements, which a re primarily funded through premium inflows and investment income. Working capital is also influenced by variable receivables fr om health benefit management contracts and ASO1performance guarantees, requiring active management and estimation. From 2023 to 2024, Cash to Sales levels reduced by 4.7 points while Working Capital/Sales reduced slightly by 0.2 points, highli ghting disciplined cost management, expense leverage, and strong balance sheet management to support their working capital needs. Source/ Note: Capital IQ; 1ASO : Administrative Services Only 15
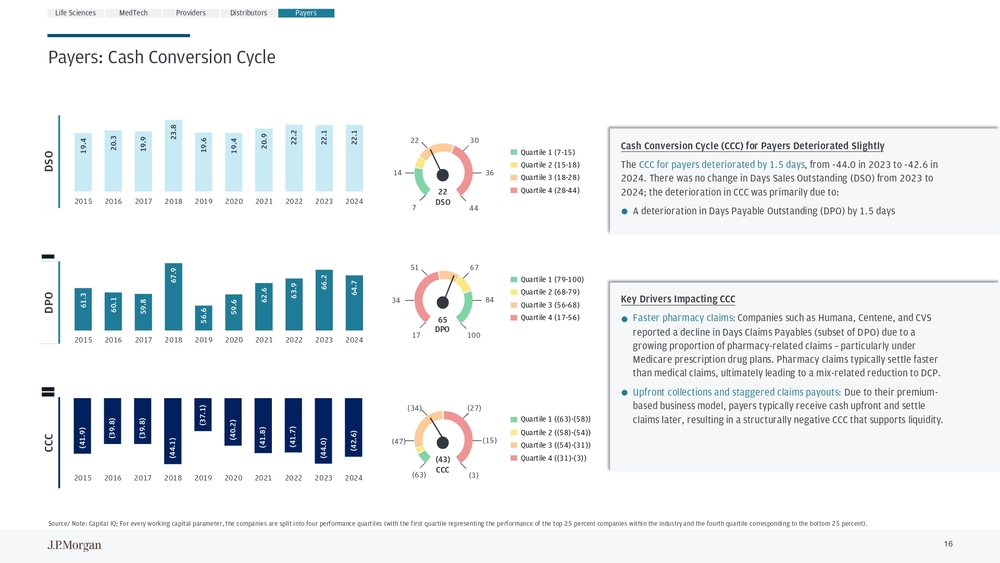
Payers: Cash Conversion CycleLife Sciences MedTech Providers19.4 20.3 19.9 23.8 19.6 19.4 20.9 22.2 22.1 22.1 2015 2016 2017 2018 2019 2020 2021 2022 2023 2024Quartile 1 (7- 15) Quartile 2 (15- 18) Quartile 3 (18- 28) Quartile 4 (28- 44) 22 DSO22 30 36 44 714DSO 61.3 60.1 59.8 67.9 56.6 59.6 62.6 63.9 66.2 64.7 2015 2016 2017 2018 2019 2020 2021 2022 2023 2024Quartile 1 (79- 100) Quartile 2 (68- 79) Quartile 3 (56- 68) Quartile 4 (17- 56) 65 DPO51 67 84 100 1734DPO (41.9) (39.8) (39.8) (44.1) (37.1) (40.2) (41.8) (41.7) (44.0) (42.6) 2015 2016 2017 2018 2019 2020 2021 2022 2023 2024Quartile 1 ((63)- (58)) Quartile 2 ((58)- (54)) Quartile 3 ((54)- (31)) Quartile 4 ((31)- (3)) (43) CCC(34) (27) (15) (3) (63)(47)CCC Source/ Note: Capital IQ; For every working capital parameter, the companies are split into four performance quartiles (with the first quartile represe nting the performance of the top 25 percent companies within the industry and the fourth quartile corresponding to the bottom 25 percent). Key Drivers Impacting CCC Faster pharmacy claims: Companies such as Humana, Centene, and CVS reported a decline in Days Claims Payables (subset of DPO) due to a growing proportion of pharmacy -related claims –particularly under Medicare prescription drug plans. Pharmacy claims typically settle faster than medical claims, ultimately leading to a mix -related reduction to DCP. Upfront collections and staggered claims payouts: Due to their premium - based business model, payers typically receive cash upfront and settle claims later, resulting in a structurally negative CCC that supports liquidity. Cash Conversion Cycle (CCC) for Payers Deteriorated Slightly The CCC for payers deteriorated by 1.5 days , from - 44.0 in 2023 to -42.6 in 2024. There was no change in Days Sales Outstanding (DSO) from 2023 to 2024; the deterioration in CCC was primarily due to: A deterioration in Days Payable Outstanding (DPO) by 1.5 daysDistributors Payers 16
Working Capital Optimization Toolkit
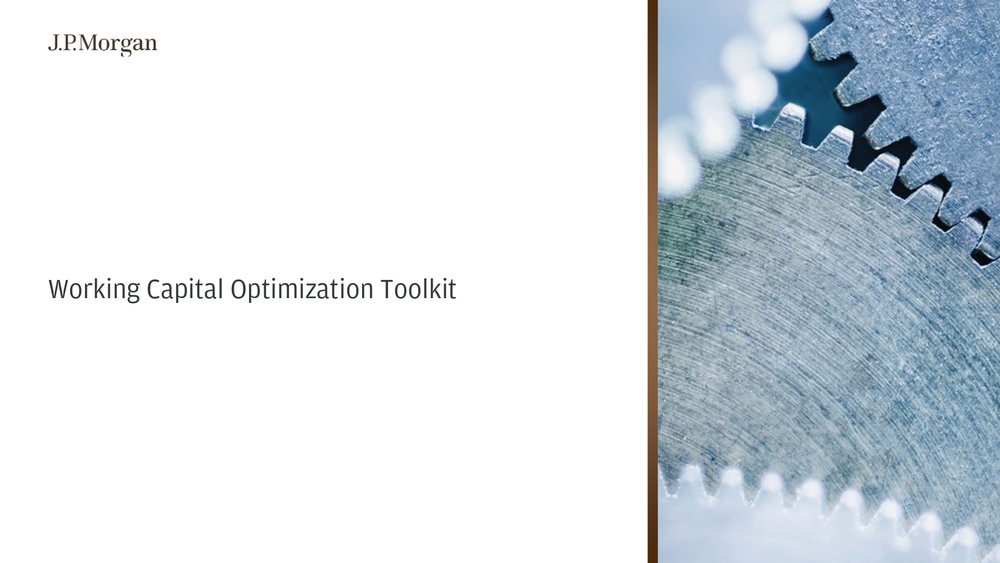
Intoday's rapidly changing business landscape, the treasury function hastranscended itstraditional boundaries tobecome a pivotal strategic partner inachieving organizational goals . Treasury isno longer confined tothe realms ofcash management and liquidity oversight ;itnow plays avital role in shaping the financial strategy and direction ofcompanies . Corporate treasuries are poised toplay apivotal role in navigating the evolving healthcare landscape and achieving strategic objectives . Asthese industries navigate complex challenges, including market volatility, regulatory shifts, and the imperative for sustainable growth, the treasury function emerges asakey enabler ofstrategic agility and resilience. Byleveraging its expertise inrisk management, capital allocation, and financial innovation, treasury isuniquely positioned todrive value creation andsupport thelong-term vision oftheorganization. Our approach focuses onthree main areas :operational efficiency, liquidity optimization, and working capital management .Working Capital Optimization Toolkit As healthcare companies navigate the changing landscape, treasury functions can utilize several tools to support strategic flexibility and resilience Liquidity Optimization Efficient cash consolidation structures are vital for optimizing liquidity utilization and facilitating prompt cross -border fund movements Fit for Purpose Treasury Centralization Models24x7 Fund MovementsGlobal Integrated Liquidity StructureOperational Efficiency In an environment where margins are under pressure, the adoption of digital solutions to automate treasury processes is essen tial for working capital efficiency Payments Modernization, Digital Commerce and Cross - Currency SolutionsRisk Intelligence –Visibility, Control and PlanningTechnology Transformation – Cloud ERP and TMS roll -outs Working Capital Optimization Improve cash flow management by focusing on solutions that expedite cash conversion, modifying payment terms with counterpart iesaccording to risk tolerance, and establishing an optimal financing level. Inventory Financing Supply Chain Financing Sales Financing With strategic insights and solutions, firms can unlock trapped capital from payables, receivables, and inventory cycles, optimizing working capital strategies for enhanced financial performance.Exploring diverse strategies for working capital optimization and tailored solutions can help create resiliency during uncertain times. A robust working capital toolkit is critical for today’s treasury and finance teams. “ “ Keith Murphy North America Head of Trade & Working Capital Sales Managing Director, J.P. Morgan Payments“ Natasha Condon Global Head of Trade & Working Capital Sales Managing Director, J.P. Morgan Payments 17 “
Conclusion & Way Forward
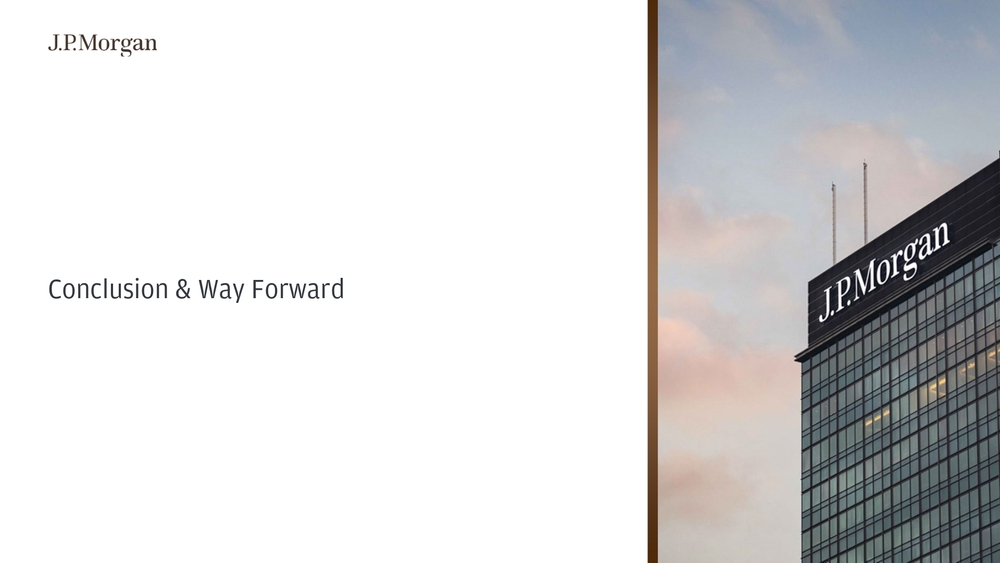
Conclusion & Way Forward In an everchanging macro environment coupled with complex industry dynamics, such as digitization, regulatory reforms, rising care costs, supply chain disruptions, and patient -centric approaches, healthcare firms must adapt and rethink business models, commercialization strategies, and supply ch ain. New care models like direct -to-consumer, at -home health and decentralized trials are reshaping revenue flows, inventory holding patterns, collections, and payment terms Healthcare companies need to be agile to capture such opportunities and recalibrate capital allocation frameworks, and ensure supporting payments infrastructure is in place Collaborations with fintech, technology, and banking partners can enhance the end -to-end customer experience and reduce friction Strategic collaborations can simplify operational processes, shorten up cash conversion cycles, enhance treasury capabilities, and enable data -driven decision making Rising tariffs and geopolitical risk call for reassessment of global vs domestic manufacturing to protect Return on Invested Capital (ROIC) and margins Companies must redesign supply chains to reduce dependency on single geographies and enhance resilience across critical inputs “ As healthcare companies focus on innovation and transforming their business models, operational efficiency remains key. Treas urers and CFOs should actively engage with internal teams to optimize working capital throughout the balance sheet. By diligently tracking cash movements, prioritizin g key expenditures, and assessing capital investments, organizations can access more affordable internal funding to weather economic pressures. “ Reimagine business models for emerging care formatsForge ecosystem partnerships to create differentiated experiencesBuild supply chain resiliency amidst an uncertain geopolitical environment Tristan Attenborough Global Head of Advisory Managing Director, J.P. Morgan Payments 18
Appendix

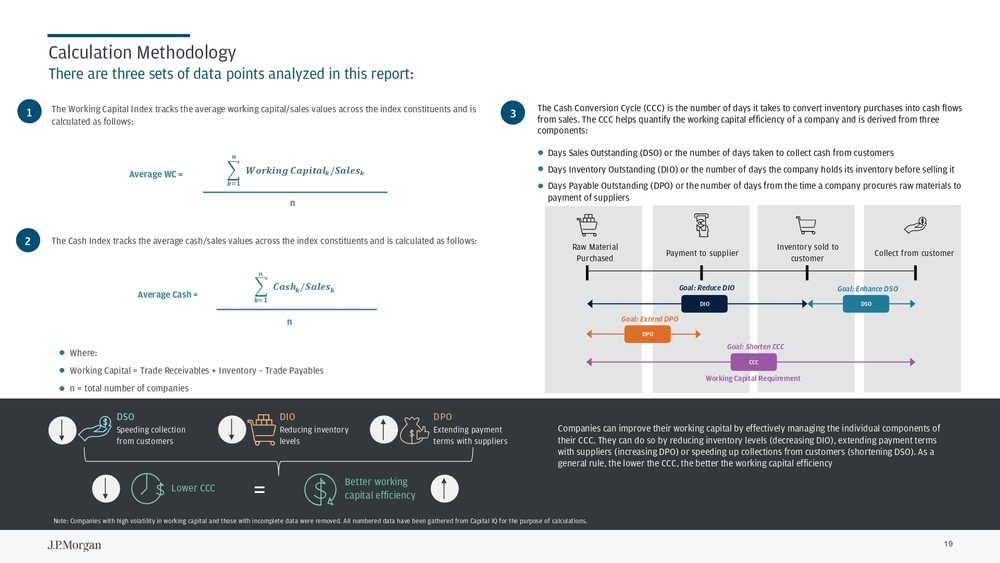
Where: Working Capital = Trade Receivables + Inventory –Trade Payables n = total number of companies n� 𝒌𝒌=𝟏𝟏𝒏𝒏 𝑾𝑾𝑾𝑾𝑾𝑾𝒌𝒌𝑾𝑾𝒏𝒏𝑾𝑾𝑪𝑪𝑪𝑪𝑪𝑪𝑾𝑾𝑪𝑪𝑪𝑪𝑪𝑪 𝒌𝒌/𝑺𝑺𝑪𝑪𝑪𝑪𝑺𝑺𝑺𝑺𝒌𝒌 Average WC = � 𝒌𝒌=𝟏𝟏𝒏𝒏 𝑪𝑪𝑪𝑪𝑺𝑺𝑪𝑪𝒌𝒌/𝑺𝑺𝑪𝑪𝑪𝑪𝑺𝑺𝑺𝑺𝒌𝒌 nAverage Cash = DPODIO DSO CCC Working Capital RequirementRaw Material PurchasedCollect from customer Payment to supplierInventory sold to customer Goal: Extend DPOGoal: Reduce DIO Goal: Enhance DSO Goal: Shorten CCCThe Working Capital Index tracks the average working capital/sales values across the index constituents and is calculated as follows: The Cash Index tracks the average cash/sales values across the index constituents and is calculated as follows:The Cash Conversion Cycle (CCC) is the number of days it takes to convert inventory purchases into cash flows from sales. The CCC helps quantify the working capital efficiency of a company and is derived from three components: Days Sales Outstanding (DSO) or the number of days taken to collect cash from customers Days Inventory Outstanding (DIO) or the number of days the company holds its inventory before selling it Days Payable Outstanding (DPO) or the number of days from the time a company procures raw materials to payment of suppliers1 23Calculation Methodology There are three sets of data points analyzed in this report: Companies can improve their working capital by effectively managing the individual components of their CCC. They can do so by reducing inventory levels (decreasing DIO), extending payment terms with suppliers (increasing DPO) or speeding up collections from customers (shortening DSO). As a general rule, the lower the CCC, the better the working capital efficiency Note: Companies with high volatility in working capital and those with incomplete data were removed. All numbered data have b eengathered from Capital IQ for the purpose of calculations.DSO Speeding collection from customersDIO Reducing inventory levelsDPO Extending payment terms with suppliers Lower CCCBetter working capital efficiency = 19
Ready to optimize cash & working capital efficiency for your business? J.P.Morgan Healthcare Payments supports healthcare organizations ofallsizes with anend-to-end suite ofpayments, treasury and banking solutions. The Healthcare Payments team uses industry expertise and healthcare -specific technology solutions topower abetter healthcare payments experience andconnect consumers, providers andpayers forevery healthcare payment transaction. With adedicated Healthcare Global Advisory team ,weoffer clients expert insights andstrategic partnership, with true understanding oftheneeds across keysub-sectors andregions .This focus andexpertise, coupled with J.P.Morgan’s unique end-to-end solutioning, allows ourAdvisory services tosupport clients inahighly relevant and impactful way, such asreimagining their payments strategy inaworld with highly complex supply chains, utilizing oursophisticated liquidity management tools, real time payments and working capital solutions across theglobe .Wehold industry focused events covering keytrends across thesector while identifying unique treasury themes that impact ourclients, toensure what wedeliver arerelevant andtimely . Raj Shenoy Executive Director Global Head of Healthcare Advisory J.P. Morgan Payments Vidisha Shah Executive Director Head of Advisory Research & Analytics J.P. Morgan Payments Anushka Dahiya Analyst Advisory Research & Analytics J.P. Morgan PaymentsAuthors Reach out to your J.P. Morgan representative today. 20

Disclaimer This presentation was prepared exclusively for the benefit and internal use of the J.P. Morgan client to whom it is directly addressed and delivered (including such client’s subsidiaries, the “Company”) in order t o assist the Company in evaluating, on a preliminary basis, the feasibility of a possible transaction or transactions and does not carry any right of publication or disclosure, in whole or in part, to any other party. This presen tation is for discussion purposes only and is incomplete without reference to, and should be viewed solely in conjunction with, theoral briefing provided by J.P. Morgan. Neither this presentation nor any of its contents may be disclosed or used for any other purpose without the prior written consent of J.P. Morgan. Additionally, this presentation may contain content initially generated by AI or other automated technologies. The information in this presentation is based upon any management forecasts supplied to us and reflects prevailing conditions and our views as of this date, all of which are accordingly subject to change. J.P. Morgan’s opinions and estimates constitute J.P. Morgan’s judgment and should be regarded as indicative, preliminary and for illustrative purposes only. In preparing this presentation, we have relied upon and assumed, without ind ependent verification, the accuracy and completeness of all information available from public sources or which was provided to u s by or on behalf of the Company or which was otherwise reviewed by us. In addition, our analyses are not and do not purport to be appraisals of the assets, stock, or business of t he Company or any other entity. J.P. Morgan makes no representations as to the actual value which may be received in connection with a transaction nor the legal, tax or accounting effects of consummating a transaction. Unless expressly contemplated hereby, the information in this presentation does not take into ac count the effects of a possible transaction or transactions involving an actual or potential change of control, which may have s ignificant valuation and other effects. Notwithstanding anything herein to the contrary, the Company and each of its employees, representatives or other agents may d isclose to any and all persons, without limitation of any kind, the U.S. federal and state income tax treatment and the U.S. fed eral and state income tax structure of the transactions contemplated hereby and all materials of any kind (including opinions or other tax analyses) that are provided to the Company relating to such tax treatment and tax structure insofar as such treatment and/or structure relates to a U.S. federal or state inc ome tax strategy provided to the Company by J.P. Morgan. J.P.Morgan's policies on data privacy can be found at http://www.jpmorgan.com/pages/privacy. J.P. Morgan is a party to the SEC Research Settlement and as such, is generally not permitted to utilize the firm's research capabilities in pitching for investment banking business. All views contained in this presentation are the views of J.P. Morgan’s Investment Bank, not the Research Department. J.P. Mo rgan’s policies prohibit employees from offering, directly or indirectly, a favorable research rating or specific price target, or o ffering to change a rating or price target, to a subject company as consideration or inducement for the receipt of business or for compensation. J.P. Morgan also prohibits its research analysts from being compensated for involvement in investment banking transactions except to the extent that such participation is intended tobenefit investors. Changes to Interbank Offered Rates (IBORs) and other benchmark rates: Certain interest rate benchmarks are, or may in the future become, subject to ongoing international, national and other regul atory guidance, reform and proposals for reform. For more information, please consult: https://www.jpmorgan.com/global/disclosures/interbank_offered_rates JPMorgan Chase & Co. and its affiliates do not provide tax advice. Accordingly, any discussion of U.S. tax matters included herein (including any attachments) is not intended or written to be used, and cannot be used, in connection with the promotion, mar keting or recommendation by anyone not affiliated with JPMorgan Chase & Co. of any of the matters addressed herein or for the purpose of avoiding U.S. tax- related penalties. J.P.Morgan is a marketing name for investment businesses of JPMorgan Chase & Co. and its subsidiaries and affiliates worldwide. S ecurities, syndicated loan arranging, financial advisory, lending, derivatives and other investment banking and commercial banki ng activities are performed by a combination of J.P. Morgan Securities LLC, J.P. Morgan Securities plc, J.P. Morgan SE, JPMorgan Chase Bank, N.A. and the appropriately licensed subsidiarie s and affiliates of JPMorgan Chase & Co. worldwide. J.P. Morgan deal team members may be employees of any of the foregoing entities. J.P. Morgan Securities plc is authorized by the Prudential Regulation Authority and regulated by the Financial Conduct Authority and the Prudential Regulation Authority. J.P .Morgan SE is authorised as a credit institution by the German Federal Financial Supervisory Authority ( Bundesanstalt fürFinanzdienstleistungsaufsicht , BaFin ) and jointly supervised by the BaFin , the German Central Bank (Deutsche Bundesbank) and the European Central Bank (ECB). For information on any J.P. Morgan German legal entity see: https://www.jpmorgan.com/country/US/en/disclosures/legal -entity -information#germany . For information on any other J.P. Morgan legal entity see: https://www.jpmorgan.com/country/GB/EN/disclosures/investment -bank -legal- entity -disclosures . JPMS LLC intermediates securities transactions effected by its non -U.S. affiliates for or with its U.S. clients when appropriate and in accordance with Rule 15a -6 under the Securities Exchange Act of 1934. Please consult: www.jpmorgan.com/securities -transactions This presentation does not constitute a commitment by any J.P. Morgan entity to underwrite, subscribe for or place any securities or to extend or arrange credit or to provide any other servic es. Copyright 2025 JPMorgan Chase & Co. All rights reserved. JPMorgan Chase Bank, N.A., organized under the laws of U.S.A. with limited liability. Privacy | Terms of Use | Accessibility | Cookies Policy | Regulatory Disclosures